
Introduction
Utilization of actigraphy to assess undiagnosed sleep disturbances among healthy adults in home-based settings Zaswiza M Noor 1 , Alesha Smith 1 , Simon Smith 2 , Lisa Nissen 1 1 School of Pharmacy, The University Of Queensland, Woolloongabba, QLD

Introduction
E N D
Presentation Transcript
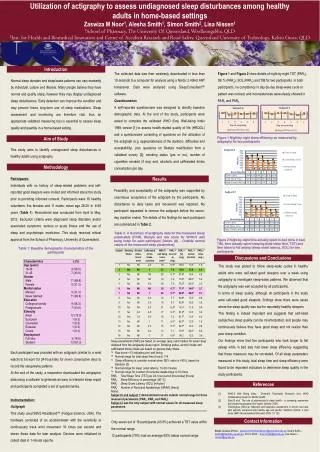
Utilization of actigraphy to assess undiagnosed sleep disturbances among healthy adults in home-based settings Zaswiza M Noor1, Alesha Smith1, Simon Smith2, Lisa Nissen1 1School of Pharmacy, The University Of Queensland, Woolloongabba, QLD 2Inst. for Health and Biomedical Innovation and Centre of Accident Research and Road Safety, Queensland University of Technology, Kelvin Grove, QLD Introduction The collected data was then wirelessly downloaded in less than 15 seconds to a computer for analysis using a Nordic 2.4GHz ANT transceiver. Data were analysed using SleepConsultant™ software. Questionnaires A self-reported questionnaire was designed to identify baseline demographic data. At the end of the study, participants were asked to complete the validated WHO (five) Well-being Index 1998 version[1] to assess health-related quality of life (HRQOL) and a questionnaire consisting of questions on the utilization of the actigraph(e.g. appropriateness of the duration, difficulties and acceptability), plus questions on lifestyle modification from a validated survey [2]; smoking status (yes or no), number of cigarettes smoked (if any) and, alcoholic and caffeinated drinks consumption per day. Figure 1 and Figure 2 show details of night-by-night TST (PAR1), SE % (PAR2), SOL (PAR3) and TIB for two participants. In both participants, no consistency in day-by-day sleep-wake cycle or pattern was noticed, and inconsistencies were clearly showed in PAR1 and PAR3. Normal sleep duration and sleep/wake patterns can vary markedly by individual, culture and lifestyle. Many people believe they have normal and quality sleep, however they may display undiagnosed sleep disturbances. Early detection can improve the condition and may prevent future long-term use of sleep medications. Sleep assessment and monitoring are therefore vital, thus an appropriate validated measuring tool is essential to assess sleep quality and quantity in a home-based setting. Aim of Study Figure 1 Night-by-night sleep efficiency as measured by actigraphy for two participants This study aims to identify undiagnosed sleep disturbances in healthy adults using actigraphy. Methodology Participants: Individuals with no history of sleep-related problems and self-reported good sleepers were invited and informed about the study prior to providing informed consent. Participants were 16 healthy volunteers; five females and 11 males; mean age 28.25 ± 6.68 years(Table 1). Recruitment was conducted from April to May, 2012. Exclusion criteria were diagnosed sleep disorders and/or associated symptoms, serious or acute illness and the use of sleep and psychotropic medicines. This study received ethical approval from the School of Pharmacy, University of Queensland. Table 1: Baseline demographic characteristics of the participants Each participant was provided with an actigraph (similar to a wrist watch) to be worn for 24-hours/day for seven consecutive days to record the sleep/wake patterns. At the end of the study, a researcher downloaded the actigraphic data using a software to generate an easy to interpret sleep report and participants completed a set of questionnaires. Instrumentation: Actigraph This study used SBV2 Readiband™ (Fatigue Science, USA). The hardware consisted of an accelerometer with the sensitivity to continuously track wrist movement 16 times per second and stores these data for later analysis. Devices were initialized to collect data in 1-minute epochs. Results Feasibility and acceptability of the actigraphywas supported by unanimous acceptance of the actigraph by the participants. No disturbance to daily tasks and movement was reported. No participant requested to remove the actigraph before the seven-day duration ended. The details of the findings for each participant are summarized in Table 2. Table 2: A Summary of actigraphy data for the measured sleep parameters (PAR), lifestyle and raw score for WHO-5 well being index for each participant. [Notes: (#) - Outside normal values of the measured sleep parameters] Figure 2 Night-by-night time actually spent in bed (time in bed, TIB), time actually spent sleeping (total sleep time, TST) and time taken to fall asleep (sleep onset latency, SOL) for two participants Discussions and Conclusions This study was piloted to follow sleep-wake cycles in healthy adults who were self-rated good sleepers over a week using actigraphy to investigate sleep-wake patterns. We observed that the actigraphy was well accepted by all participants. In terms of sleep quality, although all participants in the study were self-rated good sleepers, findings show there were cases where the sleep quality was low for reportedly healthy sleepers. This finding is indeed important and suggests that self-rated (subjective) sleep quality can be misinterpreted, and people may continuously believe they have good sleep and not realize their poor sleep condition. Our findings show that five participants who took longer to fall asleep while in bed also had lower sleep efficiency suggesting that these measures may be correlated. Of all sleep parameters measured in this study, total sleep time and sleep efficiency were found to be important indicators to determine sleep quality in the study participants. Sleep parameters (PAR) are based on average (avg.) and median for seven days obtained from the actigraphy sleep report. Smoking status, alcohol intake and caffeinated drinks intake are based on general daily intake. *a Raw score <13 indicates poor well being *b Normal range for total sleep time (hours): 7-9 *c Sleep efficiency is consider normal when SE% value is >85%, based on literature [3] *d Normal range for sleep onset latency: 10-20 minutes *e Normal range for number of nocturnal awakenings: 0-16 times PAR1 Total Sleep Time (TST) per 24- hour period (hours/day) [hours] PAR2 Sleep Efficiency in percentage (SE %) PAR3 Sleep Onset Latency (SOL) [minutes] PAR4Number of Nocturnal Awakenings (NWAK) [times] Notes: Subject 6 and subject 7 demonstrated results outside normal range for three measured parameters (PAR1, PAR2 and PAR3) Subject 2 was the only subject with normal values for all measured sleep parameters. -------------------------------------------------------------------------------------------------------------- References • [1] WHO-5 Well Being Index . Denmark: Psychiatric Research Unit, WHO Collaborating Center for Mental Health. • [2] Saini Bet.al. The role of pharmacists in sleep health – a screening, awareness and monitoring program: final report. Sydney; 2009. • [3] O’Donoghue GM et.al. Objective and subjective assessment in chronic low back pain patients compared with healthy age and gender matched controls: a pilot study. BMC Musculoskeletal Disorders 2009; 10: 122. Only seven out of 16 participants (43.8%) achieved a TST value within the normal range . 12 participants (75%) had an average SE% below normal range. Contact Information Email: Zaswiza M Noor- zaswiza.bintimohamadnoor@uqconnect.edu.au; Alesha Smith – asmith@pharmacy.uq.edu.au; Simon Smith – simon.smith@qut.edu.au; Lisa Nissen – l.nissen@uq.edu.au


