Download
1 / 31
310 likes | 494 Views
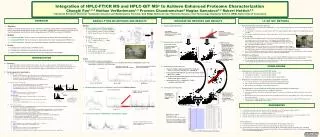
Proteomics In R . Marc Coram University of Chicago FHCRC Summer Visit (2004). Goals for this Talk. Demonstrate R-based proteomics tools Analyze 4-5 mix data Show how to use the tools Explain statistical reasoning Show pros and cons Describe future directions. Why R?.

E N D
Proteomics In R Marc Coram University of Chicago FHCRC Summer Visit (2004)
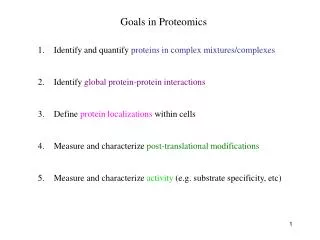
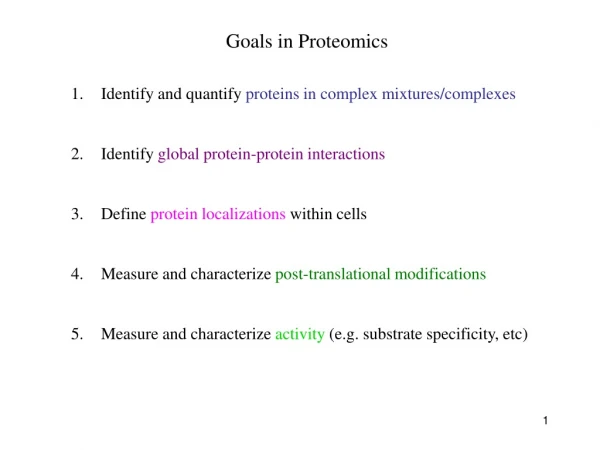
Goals for this Talk • Demonstrate R-based proteomics tools • Analyze 4-5 mix data • Show how to use the tools • Explain statistical reasoning • Show pros and cons • Describe future directions
Why R? • Promotes interactive, incremental research • Functional programming / scripting • Makes it easy to look at your data in novel ways • Large library of built-in statistical functionality, plotting functions, and matrix operations • Can use external C-code to speed up slow operations • Freely available • Familiar environment for many statisticians
Why Not R? • It’s not Java • …but the viewer is • …so working across platforms requires effort • Interpreted, not compiled
Best of Both? • R platform for statisticians • Java mzXML viewer tool with: most functionality built in new functionality through R interface
File Overview • mzXMLinterface provides a low-level interface to mzXML files. It wraps the Random Access Minimal Parser [RAMP] C-code available on Sashimi • Nimbus0 includes fftmix.R which approximates a single mzXML scan as a mixture of skew-t densities in order to detect peaks • Nimbus1 includes prot*.R which demonstrate first-draft versions of 2D LC-MS analysis code for smoothing, background estimation and removal, peak identification, and de-isotoping on windows of the mzXML file • Nimbus2 is an [incomplete] reimplementation of Nimbus1 with facilities for processing the whole file by first splitting it into m/z bands for efficient file access and then combining windowed analyses • Align_with_Hua contains [preliminary] code to align extracted peptides across files using an MCMC to resolve ambiguous cases
Installing mzXMLinterface • Obtain and unpack mzXMLinterface archive from me • Obtain root / administrator priviledges on your machine and a working R installation • Install mzXMLinterface as an R library: R CMD INSTALL mzXMLinterface • [Precompiled windows .dll available; otherwise MinGW gcc-compiler and ActiveState Perl are required; large (>2Gig) files support is disabled]
Data Overview • Files: /proteomics/4_5_mix/*.mzXML • LC-MS analysis of handmixed 4 or 5 protein solutions digested with trypsin • Raw data is basically a long list of triples: (scan, m/z, intensity) • Intensity is an integer: 0,3,4,5,6,… • The sqrt(m/z) roughly fall on the same regular grid from scan to scan
Warm-up Session > library(mzXMLinterface) > f=mzXMLopen('/proteomics/4_5_mix/05_19_04_Run01.mzXML') > print(c(f$firstscan, f$lastscan)) [1] 1 1862 > s=mzXMLgetscan(681) > print(attributes(s)) $names [1] "scan" "msLevel" "peaksCount" "retentionTime" [5] "lowMZ" "highMZ" "precursorMZ" "mz" [9] "intensity" > plot(s$mz, s$intensity, type='h', xlim=c(780,789))
Square-root Grid > x=diff(sqrt(s$mz)) > plot(x,ylim=c(0,3E-3))
Mixture Analysis • Model the intensities in a scan as independent Poisson random variables, but where the mean-parameter changes with m/z; call this function f • Approximate f as a mixture of skew-t densities of a pre-specified shape centered at each m/z-grid point but unknown weights • Estimate the weights by penalized maximum likelihood. The penalty encourages the weights to be sparse
2D Analysis using Nimbus2 source('nimbus.tools.R') source.dir='../dat' dest.dir='./dat' s=opensplit('05_19_04_Run01.mzXML') R=loadregion(s,mz=c(502,512),t=c(400,800)) viewregion(R) S=smoothR(R) P=getpeaks(S) viewregion(S,close=F) drawpeaks(P) closeview()
Background Estimation Steps 2. Create weights that softly screen away large values 1. Smooth 3. Then take the locally weighted average [I use a wide-bandwidth in time]
Comparison • Let’s compare and contrast the 4-mix and 5-mix files from May 20th in the mz-range 800 to 815 • Later, specifically, we compare the 4th and 5th, which had 4 and 5 proteins respectively
5-mix is black circle, 4-mix is magenta squareBlank background
5-mix is black circle, 4-mix is magenta square4-mix data is background
5-mix is black circle, 4-mix is magenta square5-mix data is background
Future Directions • Demonstrate de-isotoping and alignment algorithms “peptide array” • Implement an alternative 2d-peak analysis scheme closer in spirit to the 1d analysis shown • Improve interface with viewer