Download
1 / 13
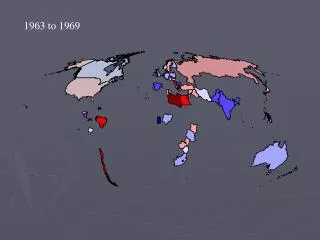
1963 to 1969
130 likes | 286 Views
1963 to 1969. 1970 to 1976. 1977 to 1983. 1981 to 1987. … the Age of Debt. 1984 to 1990. 1988 to 1994. 1963 to 1969. 1970 to 1976. The Oil Boom. 1977 to 1983. 1981 to 1987. … the Age of Debt. 1984 to 1990. 1988 to 1994. The age of globalization…. The Scale
Download Presentation 
1963 to 1969
An Image/Link below is provided (as is) to download presentation
Download Policy: Content on the Website is provided to you AS IS for your information and personal use and may not be sold / licensed / shared on other websites without getting consent from its author.
Content is provided to you AS IS for your information and personal use only.
Download presentation by click this link.
While downloading, if for some reason you are not able to download a presentation, the publisher may have deleted the file from their server.
During download, if you can't get a presentation, the file might be deleted by the publisher.
E N D
Presentation Transcript
1981 to 1987 … the Age of Debt
1970 to 1976 The Oil Boom
1981 to 1987 … the Age of Debt
1988 to 1994 The age of globalization…
The Scale Brown: Very large decreases in inequality; more than 8 percent per year. Red Moderate decreases in inequality. Pink: Slight Decreases. Light Blue: No Change or Slight increases Medium Blue: Large Increases -- Greater than 3 percent per year. Dark Blue: Very Large Increases -- Greater than 20 percent per year.


More Related