
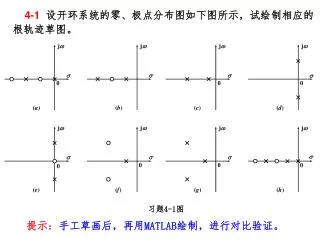
4-1 设开环系统的零、极点分布图如下图所示,试绘制相应的 根轨迹草图。
j . j . j . j . . . . . 0. 0. 0. ( a ). ( b ). ( c ). ( d ). j . j . j . j . . . . . 0. 0. 0. 0. ( e ). ( f ). ( g ). ( h ). 习题 4-1 图. 4-1 设开环系统的零、极点分布图如下图所示,试绘制相应的 根轨迹草图。. 提示: 手工草画后,再用 MATLAB 绘制,进行对比验证。. 解:.

4-1 设开环系统的零、极点分布图如下图所示,试绘制相应的 根轨迹草图。
E N D
Presentation Transcript
j j j j 0 0 0 (a) (b) (c) (d) j j j j 0 0 0 0 (e) (f) (g) (h) 习题4-1图 4-1设开环系统的零、极点分布图如下图所示,试绘制相应的 根轨迹草图。 提示:手工草画后,再用MATLAB绘制,进行对比验证。
4-2 绘制下列各开环传递函数所对应的负反馈系统的根轨迹,并确定使闭环系统稳定的K值范围。 解: 实轴上的根轨迹: 渐近线: 与虚轴交点: 起始角:
4-3 绘制下列各开环传递函数所对应的负反馈系统的根轨迹。 解: 分离点
4-4 某单位反馈系统, (1)绘制根轨迹; (2)确定引起振荡的K的最小值和等幅振荡发生前K的最大值; (3)找出等幅振荡的频率; (4)如果已知闭环系统有一对共轭极点为 , 求此时的K值和另一闭环极点。 解: 临界超调时 等幅振荡时 (1)分离点 (2) (3) (此时根轨迹有一对分支与虚轴相交) (4)
C(s) R(s) (-) 4-5设控制系统的结构图如图所示 (1) 试用根轨迹法确定系统响应无超调的K值范围; (2)若要求系统在单位斜坡输入下稳态误差小于0.5,且系统响应无超调,此时K应如何取值。 解: (对应根轨迹位于实轴的部分) (1) (2)
4-10设单位反馈系统的开环传递函数如下,试绘制参数b从零4-10设单位反馈系统的开环传递函数如下,试绘制参数b从零 变到无穷时的根轨迹图,并写出b=2时系统的闭环传递函数。 解: 等效开环传递函数为 分离点 d=-8.472 b=2时闭环传递函数