Download
1 / 19
200 likes | 327 Views
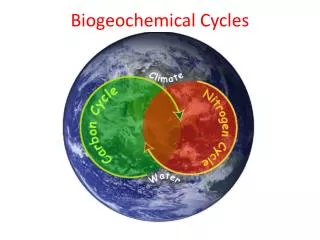
Natural and Urban “ Stormwater” Water Cycles. Our planet is covered by water, an astonishing 71 percent! “Planet Water?” If the world was uniform all the way around, water would cover the planet to a depth of 2.6 km (1.6 miles). From where did all this water come?.

E N D
Natural and Urban “Stormwater” Water Cycles • Our planet is covered by water, an astonishing 71percent! “Planet Water?” • If the world was uniform all the way around, water would cover the planet to a depth of 2.6 km (1.6 miles). • From where did all this water come?
Natural and Urban “Stormwater” Water Cycles How much water is that? • It would take 15.5 billion years for that volume of water to go over the Niagara Falls. (Scientists measure our planet to be 4.54 billion years old.) • It takes the average American 7.5 years to use the amount of water that flows over Niagara Falls every second. That’s a lot of water. Is it enough for everyone?
Natural and Urban “Stormwater” Water Cycles • 2.5% of the water on our planet is considered fresh water. • 1.7% trapped as polar ice • 0.76% fresh groundwater • 0.1% in the planet’s surface and atmosphere • Groundwater sources are not evenly distributed around the world, and excessive groundwater pumping has negative environmental impacts. • So, surface and atmospheric water are the most accessible and renewable sources of drinking water. • Global freshwater availability is estimated at 131 gallons per person per day.
Natural and Urban “Stormwater” Water Cycles • When we turn on the faucet, water always comes out. But how does it get there? And how do we know that it is safe to drink? • Civil and environmental engineers design systems to move this water from surface and groundwater sources to water treatment facilities and then to our homes. It is their job to provide quality drinking water, assuring our health and safety, and a sufficient quantity of water.
Natural and Urban “Stormwater” Water Cycles • Civil and environmental engineers use the rates of reaction to design treatment systems and must understand the phase transformation occurring as a result of the reaction, in order to provide water that is safe to drink and release back into nature. • For example, denitrification, the transformation of nitrate (NO3, a fertilizer) to nitrogen gas (N2) is a critical component in the design and management of wastewater treatment systems.
Natural and Urban “Stormwater” Water Cycles The driving force for the water cycle is the sun! Name the different parts of the water cycle… • evaporation • condensation • precipitation • infiltration • stormwater runoff • groundwater flow • plant uptake • transpiration 6
Evaporation • Definition: When water changes from aliquid to a gas (water vapor). • Phase change: Heat from the sun creates energy that breaks the bonds holding water molecules together. • Rate: Net evaporation occurs when the rate of evaporation exceeds the rate of condensation. • Examples: Boiling water, steam off a lake, river or road
Condensation • Definition: When water vapor changes from its gaseous state (vapor) to the liquid phase. • Phase change: Evaporated water vapor condenses in the atmosphere due to lowertemperatures resulting from less atmospheric pressure encountered at higher elevations. • Rate: On average, the residence time for moisture in the atmosphere is 8.2 days. • Question: A large cumulonimbus cloud can weigh as much as a 747 jumbo jet. So why does it not come crashing down to the ground?
Precipitation • Definition: Condensed water vapor that falls to Earth as rain, snow or hail. • Phase change: Water molecules combine (via condensation) with tiny dust that act as a nucleus to form cloud droplets. An increase in collisions occur with other droplets until the mass of the droplet creates a fall velocity that is greater than the cloud updraft speed, resulting in precipitation. • Rate: When the evaporation rate is less than the condensation rate, a droplet can grow into a cloud.
Infiltration and Percolation • Infiltration: The movement of water into the media layer. • Percolation: The movement of water within the media layer. • Transformation: When precipitation falls onto a pervious surface, it may infiltrate into the media layer. • A media layer is the combination of inorganic and/or organic earth materials (for example, sand, soil, mulch, compost, limestone, granite, gravel). • Infiltration and percolation rates are typically calculated in (V or L)/(T) units, such as ml/s or in/s.
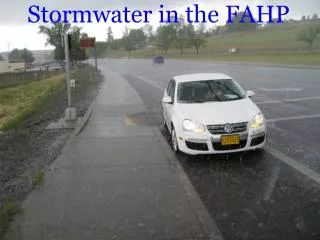
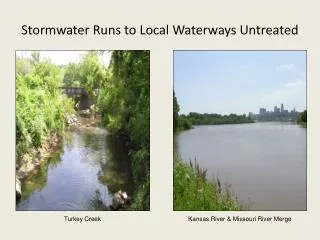
Stormwater Runoff • Definition: The flow of rainwater that occurs as a result of the precipitation rate exceeding the soil infiltration and percolation rates. • Also generated from impervious surfaces such as roofs, roads and sidewalks. • Collects particulates, nutrients and heavy metals as it travelsdown the street and into the storm sewer.
Groundwater Flow Definition: The lateral or horizontal flow of water beneath the ground surface. Groundwater levels are typically the surface level at which you can see water in a lake, or the level of a well. Storm water replenishes the groundwater table and underground aquifer through infiltration and percolation. Then this groundwater is available to flow into lakes, streams, rivers or be accessed by wells and pump stations.
Plant Uptake • Definition: The process of plants absorbing water and nutrients from roots in order to grow. • Phase change: Plants use the energy from the sun (photosynthesis) and capillary action to draw up water and nutrients and transform inorganic nutrients into organic above-ground and below-ground biomass. • Rate: Above-ground biomass uptake begins in spring, peaks in mid-summer, and is very minimal during fall and winter months.
Transpiration • Definition: The process by which plants release water into the air. • Trees typically drop their leaves to conserve water, which eliminates the pathway for transpiration. • Transformation: Process occurs to remove heat from the plant and facilitate plant uptake. • Rate: Dependent on moisture content of plant vs. surrounding air. (The engineering word is “concentration gradient.”) • Transpiration rate examples: • An acre of corn can give off 3,000–4,000 gallons of water per day. • A large oak tree can give off 40,000 gallons of water per year.
Rain collected and moved by urban infrastructure Transpiration • You are a travel magazine journalist for Urban Environment Weekly. • Your assignment this week is tofollow the life of a drop of water as it makes its way through the urban environment. • In your article, include all the descriptive details of whomthe drop met and what itencountered along the way.
Image Sources Slide 1: Image of the Earth — U.S. Environmental Protection Agency at http://www.epa.gov/region6/rsc/converses_students.html Slide 6: X-ray photograph of the sun — NASA via Science daily at http://www.sciencedaily.com/releases/2010/08/100802165451.htm Slide 6: Diagram of the water cycle – Southwest Florida Water Management District via Miami-Dade County, FL at http://www.miamidade.gov/water/water-cycle.asp Slides 7, 8, 9: evaporation-condensation-precipitation diagram — Microsoft clipart at http://office.microsoft.com/en-us/images/results.aspx?qu=evaporation&ex=1#ai:MC900278850| Slide 7: steaming coffee cup — Microsoft clipart at http://office.microsoft.com/en-us/images/results.aspx?qu=steam&ex=1#ai:MC900239561| Slide 8: dew droplets on web — Microsoft clipart at http://office.microsoft.com/en-us/images/results.aspx?qu=condensation&ex=1#ai:MP900442455| Slide 9: rain — Microsoft clipart at http://office.mirosoft.com/en-us/images/results.aspx?qu=rain&ex=1#ai:MC900311120| Slide 9: snowflakes — Microsoft clipart at http://office.microsoft.com/en-us/images/results.aspx?qu=snow+flakes&ex=1#ai:MC900331453| Slide 11: runoff drainage pipe — Microsoft clipart at http://office.microsoft.com/en-us/images/results.aspx?qu=runoff&ex=1#ai:MC900298021| Slide 12: Diagram of groundwater flow — U.S. Geological Survey at https://water.usgs.gov/edu/earthgwdecline.html Slide 13: Plant with roots in ground — Microsoft clipart at http://office.microsoft.com/en-us/images/results.aspx?qu=plant&ex=1#ai:MC900383120| Slide 14: Tree without leaves — Microsoft clipart at http://office.microsoft.com/en-us/images/results.aspx?qu=falling+leaves&ex=1#ai:MC900187917| Slide 15: Diagram of urban water cycle — City of Tucson AZ at http://www.tucsonaz.gov/water/cycle Slide 16: Storm drain system diagram — Monroe County, NY at https://www.monroecounty.gov/des-stormwater-coalition Slide 17: Diagram of urban water cycle — U.S. Geological Survey http://water.usgs.gov/edu/watercycle.html Slide 18: Diagram of natural water cycle — City of Philadelphia PA http://www.phila.gov/water/PublishingImages/urbanwatercycle.jpg