Download
1 / 23
240 likes | 486 Views
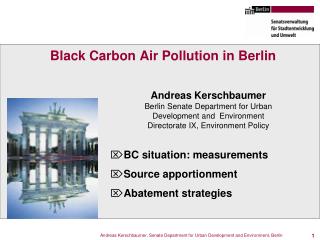
Black Carbon Air Pollution in Berlin. BC situation: measurements Source apportionment Abatement strategies. Andreas Kerschbaumer Berlin Senate Department for Urban Development and Environment Directorate IX, Environment Policy. Health. Particles. Climate. NOx. Ecosystems. SO2.

E N D
Black Carbon Air Pollution in Berlin BC situation: measurements Source apportionment Abatement strategies Andreas Kerschbaumer Berlin Senate Department for Urban Development and Environment Directorate IX, Environment Policy
Health Particles Climate NOx Ecosystems SO2 Materials Ammonia hydrocarbons Crops Introduction Impact chain of air pollution PollutionImpact Emission Sources negative effect on … Black Carbon traffic other particles house heating Nitrogendioxide power plants Acidification Industry & business Eutrophication agriculture Troposphericozone
Linksrelevant for particulate matter - BC Health Particles Climate NOx Ecosystems SO2 Materials Ammonia hydrocarbons Crops Introduction Impact chain of air pollution PollutionImpact Emission Sources negative effect on … Black Carbon traffic other particles house heating Nitrogendioxide power plants Acidification Industry & business Eutrophierung agriculture Troposphericozone
Outline EC – OC measurements in Berlin automated thermal analysis (daily means) PM10, PM2.5, PM1 RUBIS (small devices) thermal analysis (bi-weekly means) PM10 high temporal (automated) and spatial (RUBIS) coverage Source apportionment EC and OC concentrations during high PM episodes EC (or TC) local street contribution Abatement measures low emission zone (LEZ) wood burning in small combustion plants off-road machinery / construction sites
Air Quality Measurements 16 automated measurements 6 at street level 6 urban background 4 semi-rural urban areas 30 Mini-Samplers at streets higher spatial resolution 2-weekly sample periods on filters Elemental and Organic Carbon Passive Samplers for NO2 and NOx
AQ monitoring in BerlinFocus on hot spots & urban exposure & source analysis • Low emission zone • Automatic monitoring site in residential areas and at the cities’ periphery • Automatic monitoring site in busy roads at the kerbside • monitoring site with miniaturised sampling devices • passive samplers for NO2 • active PM10 mini samplers for EC/OC analysis
urban increment Source analysis schematic of PM - TC distribution total urban contribution relevant for AQ LV compliance hotspotincrement
local traffic regional background urbanbackground Sourceanalysis Berlin origin of kerbside PM2.5 Compositionof PM2.5-Contributions simplified receptor modelling speciation source contribution regional background local traffic background background
local traffic resuspension + resuspension + other sources other sources abrasion by traffic abrasion by traffic resuspension + resuspension + 4% 4% abrasion by traffic 2% 2% waste treatment and waste treatment and abrasion by traffic combustion in combustion in 4% disposal disposal road transport road transport 4% manufacturing manufacturing 0% 0% 7% 7% road transport road transport industry industry 9% 9% other mobile sources other mobile sources 2% 2% and machinery and machinery production processes production processes 4% 4% 8% 8% additional combustion additional combustion 1% 1% urban solvent and other solvent and other product use product use non-industrial non-industrial 5% 5% combustion combustion 3% 3% combustion in energy combustion in energy and tranformation and tranformation combustion in energy combustion in energy industries industries and tranformation and tranformation 1% 1% industries industries production processes production processes 9% 9% large - scale 1% 1% road transport combustion in manufacturing combustion in manufacturing non-industrial non-industrial road transport 12% industry industry combustion combustion 12% 0% 0% 10% 10% resuspension + resuspension + agriculture agriculture other sources other sources abrasion by traffic abrasion by traffic 4% 4% 11% 11% 3% 3% homemade vehicle tailpipe contribution Source analysis sources of kerbside PM2.5 background Berlin, 2007 Source: M. Pesch Technical University - Berlin
Percentage of local traffic contribution to kerbside pollution 100% 10 17 19 80% 12 10 35 heavy duty vehicles 4 7 light duty vehicles 11 60% 12 coach 7 urban bus 2 40% passenger car 59 52 46 20% 0% PM10 NO2 Total Carbon
-70% LEZ impact: change of particle exhaust emissionsbased on fleet composition at Frankfurter Allee (new emission factor data base HBEFa 3.1) emissions extrapolated to the entire main road network based on the fleet composition at Frankfurter Allee (with DPF-retrofit, only warm emissions, no cold start impact) (preliminary results, vers. 22/3/2011)
Berlin LEZ – impact analysis total carbon concentration traffic related* black¥ carbon particle concentration in Berlin * local BC increment at traffic sites, adjusted to traffic volumes trend relative to 2007 before LEZ came into force ¥ elemental carbon (EC) particles plus other deposited organic compounds (OC)
Modernisation of public bus fleet • Objectives • all busses with filter • 600 busses With Euro5/EEV • Realisation • 94 % busses with filter • 520 busses with Euro5/EEV • Impact on Emission • 37 t/ less exhaust particles • 732 t/a less NOx
small combustiongrowing relevance biomass fuel use has become more attractive rising oil & gas prices promoted as a renewable fuel as climate protection measure projections suggest 50-100% growth in biomass burning problem for PM and BC (TC) pollution? initially focused in Scandinavia and Alpine region abandoned in the major cites of NW Europe Berlin: <2% of homes still heated with solid fuel small source in urban emission inventories average contribution 1-2 µg/m³ PM10 in Berlin/Paris/London much higher during stagnant winter episodes (>10 µg/m³ PM10) wood combustion in urban areas used as a secondary heating indication that old combustion units are still used source: UBA Vienna, 2006)
result of speciation and PMF analysis source analysis Berlin contribution of biomass burning Source: Wagener et al. (EAC 2011)
Small combustionRegulation in Aachen – Option for Berlin applies to single room heaters with 4-15 kW requires already now stricter standards for new equipment 40 mg/m³ for new devices existing units need to comply already by 2015 75 mg/m³ for existing units no extra transition periods granted requires filter technology for retrofit & sufficient market coverage initial problems for the regulator: missing framework for monitoring and control of in use filter efficiency project with real-world tests of retrofitted filters lacking market for type-approved retrofit kits lacking demand for market development similarity with road vehicle DPF retrofit development retrofit costs relatively high compared to value of heating devices
Particle filters for construction machinery • Problem: • ca. 140 t/a Diesel exhaust particles from construction machines • comparison: Diesel exhaust particles from road traffic: • 2009: ca. 224 t/a (LEZ) • 2015: ca. 124 t/a (LEZ without exemption) • Goal: • Reduction of Diesel exhaust emissions: 75% until 2015 • i.e. 100 t/a less • Obstacle: • Filter-Regeneration at different operating conditions • Costs • Filter availability
Particle Limit Values for NRMM compared to heavy-duty vehicles Limit values for new registration stage IIIA stageII and IIIA stageII and IIIA stageII and IIIA stage IIIB
Emission standards for machinery operating for public construction sites in Berlin • Diesel machinery: • from 2014: particle limit value stage IIIB (0,025 g/kWh), e.g. Filter retrofitting for engines ≥ 37 kW • from 2014: particle limit value stage IIIA for engines from 19 to 37 kW • Ignited machinery: • engines < 19 kW emission standards stage II according to directive 97/68/EG , also two-stroke engines • other two-stroke engines banned