Download
1 / 20
200 likes | 297 Views
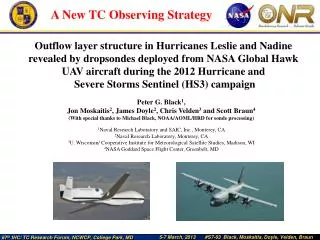
Analyses of hurricane outflow layer structure u sing dropsonde observations deployed from a NASA Global Hawk AUV during HS3. Peter G. Black 1 , Jon Moskaitis 2 , James Doyle 2 , Chris Velden 3 and Scott Braun 4

E N D
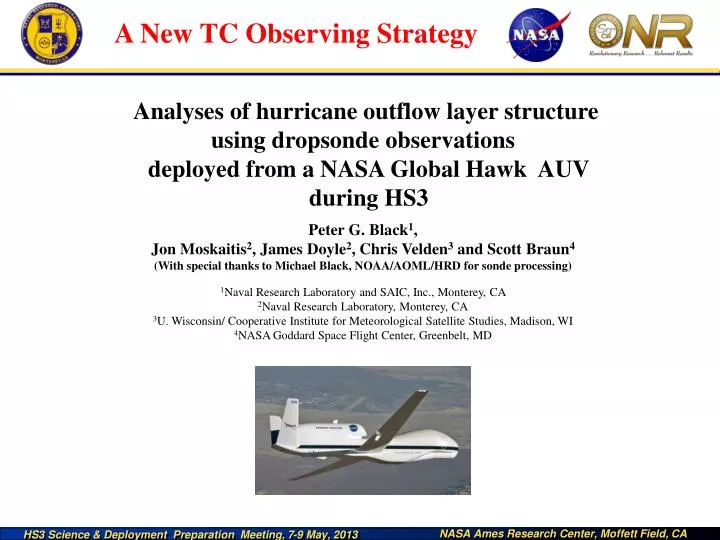
Analyses of hurricane outflow layer structure using dropsonde observations deployed from a NASA Global Hawk AUV during HS3 Peter G. Black1, Jon Moskaitis2, James Doyle2, Chris Velden3 and Scott Braun4 (With special thanks to Michael Black, NOAA/AOML/HRD for sonde processing) 1Naval Research Laboratory and SAIC, Inc., Monterey, CA 2Naval Research Laboratory, Monterey, CA 3U. Wisconsin/ Cooperative Institute for Meteorological Satellite Studies, Madison, WI 4NASA Goddard Space Flight Center, Greenbelt, MD
Key Science Issue • Understand the coupling between the inflow and outflow branches of the secondary circulation (and the relationship of this coupling to intensity changes): • Upper-level outflow changes lead to increased convection and intensification. • Active Outflow • Interaction of environment with TC • Upper-level outflow changes result from increased convection/ low level forcing • Passive Outflow • Interaction of TC with environment • Dependencies on boundary layer characteristics • Secondary eyewall cycles
Strategy: 1) Global Hawks to observe the outflow layer and environment 2) WC-130Js to observe the inflow layer structure and intensity Upper-Level Outflow Upper-Level Outflow CPL HIRAD HIWRAP GPS Dropsonde GPS Sonde Radar Low-Level Inflow SFMR Secondary Circulation: IN, UP & OUT Background schematic courtesy of NASA
Observational Strategy • Global Hawk: • AV-1 remote sensors • HIRAD • HIWRAP • HAMSR? • AV-6 Remote Sensors • CPL • S-HIS • AVAPS Dropsondes • Outflow layer vertical • structure 15 Outflow 10 Height (km) • Air Force WC-130J: • SFMR: Surface winds/ intensity • Radar: Precipitation structure • AVAPS Dropsondes: Inflow layer vertical structure 5 Radar SFMR 0 Strategy:i) Global Hawks to observe the outflow layer and environment ii) WC-130J to observe inflow layer and inner-core intensity 300 600 100 radius (nm)
Lifecycle Hypothesis • Schematic of Outflow Channel Morphology from 7 case studies: • WPAC: Roke and Songda • ATL: Earl and Irene • GOM: Charlie, Katrina, and Opal • Led to hypothesis relating TC outflow morphology changes to TC intensity changes: II. I. III. HYPOTHESIS: There is a characteristic evolution of the outflow as the storm interacts with the environment that corresponds to changes in intensity and structure. Phase I- TC development Phase II- RI Phase III- Mature & decay
Leslie (7 Sept, 2012): Divergent outflow jets resulting from environmental interaction force inner-core convection? ACTIVE OUTFLOW Nadine (14-15 Sept, 2012): Outflow forced by Supercell Convection? PASSIVE OUTFLOW OR
NASA HS3 Observations of Leslie and Nadine 76 Drops 80 kts 55 kts NASA HS3 Global Hawk Flight Tracks Nadine: 11 Sep – 04 Oct 2012 50 kts 70 kts 58 Drops 65 kts 65 kts 75 Drops 70 Drops 35 kts 34 Drops 30 Drops • Nadine was the 5thlongest-lived Atlantic hurricane on record. • Nadine intensity varied from a 35 knot tropical storm to 80 knot hurricane. • NASA HS3 Global Hawk deployed over 300 dropsondesduring 5 flights in Nadine and 30 dropsondes in Leslie.
Global Hawk Dropsonde Failure Rate- Nadine, 2012 No. reporting = 283
HS3 Observations of Leslie’s Outflow (150 mb) Leslie CAT1 80 60 Vmax (kt) 40 Leslie Center CIMSS SATCON 20 X 9 8 7 5 4 6 Sept Cross Section 6 sondes
HS3 Observations of Leslie’s Outflow 7 Sep 2012 1041-1111Z Black, Red, Blue and Pink lines: Global Hawk observed wind speed and temperature profiles along jet maximum from dropsondes Green line: COAMPS-TC model wind speed profile Red line: Satellite wind speed vertical average Solid black:Tropopause Dashed: Cirrus top / jet max Dotted: Cirrus cloud base Yellow shading: Cloud Physics Lidar (CPL) domain
Tropopause Total Wind Speed Isotachs every 2.5 m/s Cloud Physics LIDAR (CPL): Outflow layer cloud image North South • HS3 dropsondes reveal unprecedented detail in depiction of outflow jet • Sharp shear zone just above the sloping tropopause (~14 km) and below outflow jet • Top of outflow jet coincident with top of cirrus deck from CPL • Detailed cirrus fine structure suggestive of multiple turbulent mixing mechanisms
Nadine CIMSS shear: 0-20 kt SHIPS/CIRA shear: 0-50 kt SHIPS/CIRA SST: 20-30 C RSS MW-OI SST: 20-30 C 30 25 20 15 10 GH AV-6 Flight 5
Outflow jet in Nadine, 14-15 Sept, sampled by multiple dropsondes (triangles- left) • and Atmospheric Motion Vectors (AMVs- right). • Outflow originates with active supercell west of center
Outflow forced by SUPERCELL Convection: PASSIVEOUTFLOW? OR: Supercell forced by divergent outflow as a result of environmental interaction: ACTIVE OUTFLOW
Double jet max below tropopause • (dashed line) • Main jet max decreases in height, • becomes stronger and thinner with • increasing radial distance. • Structures repeatable in 6 sondes • along jet max. • Double wind max and constant • wind layers are not observable with • satellite AMVs over layer average • (green dashed line) and may reflect • physical processes not presently • understood.
Green is CIMSS mean upper wind at sonde location.
Dramatic Upper-Level Outflow Change during Hurricane Sandy • Jet streak associated with upper-level trough (thick blue arrow) approaches Sandy, creating expanded outflow structure (white arrows) toward the north and east. • Intensity decreases slightly, but the size of the storm increases dramatically. • Strong anticyclonic outflow displaced east of the center (pink dot): supports asymmetric deep convection. 10/27/06z: Sandy intensity = 60 kt • Strong outflow displaced west and north, intensifying and expanding (jet max of 100–140 kt), with dramatic change forced by intensifying ridge northeast of Sandy (blue arrows) . • Sandy intensifies, further expands and accelerates just prior to landfall. 10/29/12z: Sandy intensity = 80 kt
Resulting Hurricane Sandy Landfall Impact • Landfall of larger, more intense storm 12-hours earlier than expected. • Devastating storm surge superimposed on high tide rather than weaker storm surge superimposed on low tide 12-hours later. • Driven by Active Outfow?
Key Results • Fine scale outflow layer features and vertical outflow jet structures were recently observed in • Hurricanes Leslie and Nadine (2012) by dropsondes deployed from high-altitude Global Hawk AUV • They provide a new and more accurate representation of TC outflow layers that complement time • evolution provided by AMV’s only. Recommendations and Future Plans • Focus 2013-14 flight plans on more detailed dropsonde observation of outflow jet vertical structure (see following final slide). • Obtain observation of magnitude and phasing of low-level mass inflow with respect upper mass outflow and jet structure evolution, i.e. secondary circulation development. • Extend Global Hawk outflow layer studies to WPAC monsoon depression TCs and interaction with WPAC TUTT cells.
Outflow Jet Racetrack pattern Outflow Jet Fan pattern