Download
1 / 44
440 likes | 469 Views
Explore Hg distribution in SF Bay cores, dating methods, wetland loading history, and implications for modeling and monitoring. Analyze Hg profiles for accuracy and predictability. Identify key factors impacting Hg fate.

E N D
Hg in SF Bay Cores SF Bay Hg Coordination Meeting Feb 2009
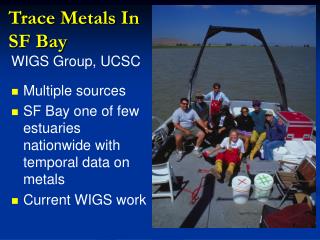
Background • USGS (1990) coring • 90+ sites screened only • 2 depositional sites fully characterized • Subsurface max @ 2 sites • Pollutant reservoir? • Why Recore? • 2 of 90 sites probably not representative • Old cores unusable for chem analyses
Core- What Is It Good For?(absolutely something) • Bay pollutant inventory • Erosional time bombs? • Model validation • Conceptual &/or mechanistic • Model development • Empirical, mechanistic, hybrid
Distribution of Sites (Bay) • Representative • inventory, sedimentation • 3 sites Central Bay, 2 sites each other segments • Preference to RMP repeat stations
Distribution of Sites (Wetland) • Loading history • Depositional zones • 1 site each segment • Pt Edith Martinez • Wildcat Richmond • Damon Sl. Oakland • Greco Island • Coyote Creek • Alviso Marina
Conceptual Model • Sedimentation (from isotopes, bathymetric history) • Similar in segment (shared water, sediment) • But mesoscale differences (trib/shore proximity, etc) • Pollutant (Hg) distribution function of • Sedimentation history • Local land use/ loading
Dating: Bathymetric History (USGS Bruce Jaffe) • Sum bathymetric changes between surveys + deposition – erosion • Some sites depositional & erosional different periods
Dating: Isotopes • (USC Hammond) • Cs in A-bomb • max ~1960 • Pb decay • half life 22 yrs • Decay/ mixing dilution can look similar • Cs & Pb similar • likely mixing dilution
Results • Sites within segments similar (from bathymetry and radiodates) • Suisun, San Pablo eroding • Central, South neutral/eroding • Lower South accreting • Wetland Hg indicates loading history • Subsurface max in wetlands everywhere • Layer often near surface (1950s?)
Lower South / South Bay1960 = 30-60cm bay, 80cm wetland 12-15cm bay, 30cm wetland 1960 1960 1960 1960
San Pablo & Suisun Bay1960= 2-5cm bay, ??wetland 2-80cm?! bay, ??wetland 1960 1960
Results • Bay core Hg often ~uniform, or complex • RMP segment avg ~ core top section • Weak/no subsurface max in Bay sites • Mixing, erosion (or ~constant loads)? • All could give ~uniform profile • Some sites not well predicted (esp SU002) • Bathymetry, Cs, Hg mismatch • Multiple deposition & erosion w/ seds from different watersheds
Implications? Few Hg ticking time bombs in Bay So far, so good (2 of [90 + 11]) Largely WYSIWYG (surface ~ middle) Wetland cores capture historical pulses Historical Hg loads mostly eroded, dispersed in Bay
Next Steps • Finish wetland radiodating • More normalization? (high TOC in wetlands) • Model accretion vs mixing for isotopes (USC) • Understand data discrepancies • Analytical variation, spatial/temporal differences • Implications for other work • More coring, modeling • Partial report 2009 Q1, Pulse of Estuary • All done 2009 Q3?
SF Bay MeHg Mass Budget SF Bay Hg Coordiantion Meeting Feb 2009 (RMP Annual Meeting Oct 2008)
WWMMBD? What Would the MeHg Mass Budget Do? • Track MeHg specifically • MeHg <1% of totHg, poor MeHg:totHg correlation • Synthesize- do Bay data make sense given… • Loading, production, degradation, sed-water exchange, etc. • Quantitative dimension to MeHg conceptual model • ID key factors for MeHg fate • Refined models feasibility/needs • E.g. temporal & spatial detail What it won’t/can’t do • Turn water to wine (not J) • Identify “hot” spot impacts (1 box) • Predict long term (no Hg linkage) WWMMBD?
MeHg 1 Box Model • Many simple assumptions (from PCB 1 box) • One water compartment • One sediment compartment (10cm mixed layer) • Daily time step • Annually uniform loads (no seasonality) • Uniform mixing • Equilibrium partitioning • Long term steady state • Simplifications worked for PCBs, PBDEs • Can it work for MeHg?
Does It Work? - Reasonably • Base case = average • initial concentrations (from RMP monitoring) • loading/process parameter values • At steady state • Sediment mass ~ • Water mass lower • Fast! <1 month
Base Case Run Mass (inventory) vs daily flux/degrade/produce • Water Mass External load>, Net sediment to water exchange = Degradation>, GG outflow, >> bio-uptake,volatilization • Total (Water+Sediment) Production ~balances degradation >> all other processes * Flux box within ~2x: ~.014 kg/d (Choe et al, N Bay)
WDMMBD? What Did the MeHg Mass Budget Do? • Show Bay data reasonable • Base case ~T0 state- near “right” Baywide, but non-unique solution (e.g. offsetting errors?) • Feasibility/needs of refined model(s) • 1 box driven by steady state/equilibrium • Basis for more detailed (time/space) model? • Much higher data needs • Key factors affecting mid term MeHg fate • External loads small/medium effect on Baywide scale • Very sensitive to de/meth rates
Management Strategy – Dr. Evil Acquire $1 Million Option A- Control meth: • Sterilize Bay w/ thermonuclear device Option B- Control Demeth: • Equip sharks w/ frickin UV lasers
Management Strategy -RMP • Option C- RMP Mercury Strategy: • Where biota affected (food web entry) • ID disproportionate (high leverage) pathways • ID intervention opportunities • THEN act (e.g.holding ponds, aeration, dredging, nutrient reductions, sed amendments, etc) • Monitor & model management effectiveness “adaptive management” (likely cost > $1 million)
Acknowledgements Too many to list… “If I have seen further it is by standing on ye shoulders of Giants” – Sir Isaac Newton HGH? (not Hg) researcher
LSB Metals • Downcore concentrations noisy • Coyote Creek Hg max > Alviso! • Coyote Hg max @ 1960s depth (80cm) • Coyote Cu max @ 40cm = 1980s? • ~max Cu discharge late 1970s (Palo Alto) • ~surface sediment Cu USGS long term data
SB001: Continuous Erosion? ~0cm to 1960 ~15cm to 1960 Core ID: SB001, X: 564867.30345800000, Y: 4163027.61900000000 1858 depth: -122 1898 depth: -123 1931 depth: -157 1956 depth: -124 1983 depth: -146 2005 depth: -160 2006 depth: -161 Reconstructed horizons: 0
SB002: No Change ~1950s ~0cm to 1960 ~12cm to 1960
SB Wetland Deposition ~30cm to 1960
South Bay Metals • Downcore concentrations noisy • Cu max @ Greco Island similar to Coyote, but into 1960s zone. • Greco Hg max ~constant in wetland to 55cm (1960s Cs penetration to 30cm) = 1930s?
CB001: No Change ~1940s ~0cm to 1960 ~5cm to 1960
CB002: Erosion to ~1920s ~0cm to 1960 ~20cm to 1960
CB006: Continuous Erosion ~0cm to 1960 ~12cm to 1960 Core ID: CB006A, X: 566290.21976900000, Y: 4174242.03589000000 1858 depth: -106 1898 depth: -134 1931 depth: -132 1956 depth: -183 1983 depth: -220 Reconstructed horizons: 0
Central Bay Metals • Bay downcore concentrations smaller range than in SB/LSB • No dating for wetland cores yet • ~20cm surbsurface max for Hg, Se, Cu in wetland, • Similarly high conc for Se, Cu @ surface, 60cm
SPB001: Erosion to ~1920s ~0cm to 1960 ~5cm to 1960
SPB002: Erosion to ~1880s ~0cm to 1960 ~2cm to 1960
San Pablo Metals • ~20cm surbsurface max for Hg, Se, Cu in wetland • No dating for wetland cores yet • No secondary metal peaks • Deeper concentrations fairly constant
SU001: Erosion to ~1910s ~0cm to 1960 ~2cm to 1960
SU002: Erosion to ~1890s ~0cm to 1960 ~80cm to 1960?!!
Suisun Metals • Hg highly variable @ Pt Edith and SU002 • No dating for wetland cores yet • SU002 max concentrations in top section • Hg, Se, Cu, subsurface spikes as well