Download
1 / 36
360 likes | 377 Views
Learn what exponential functions are, how to graph exponential growth and decay, and solve problems involving exponential growth and decay.

E N D
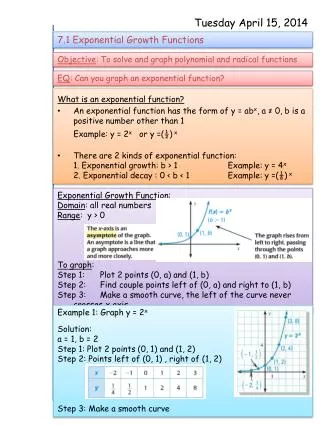
Lesson 10.1 Objective: I can: - Determine what an exponential function is - Graph exponential Growth
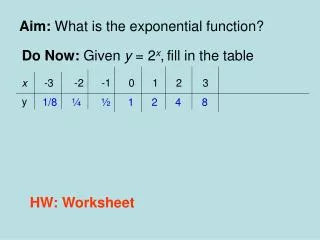
What is an “exponential function”? Example: Someone gives you 2¢ on April 1, 4¢ on April 2, and so on (doubling each day) until the end of the month. How much will you receive on April 30? day ¢ Exponential functions grow slowly at first, then get really, big, really fast! 1 2 ¢ 2 2(2) or 22 = 4 ¢ 3 2(2)(2) or 23 = 8 ¢ 4 24 = 16 ¢ 5 25 = 32 ¢ 30 230 = 1,073,741,824 ¢
Number of cell phone service subscribers, 1985 - 2000 How many do you think there are now? 270 million in 2008 (only 305 million people in the US in 2008!)
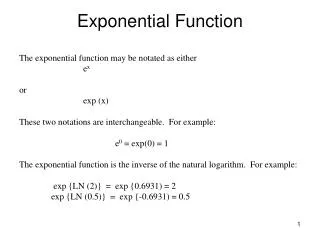
What it looks like b a x y = (0, b) = y-intercept a = growth factor for today, a > 1 • the variable is the exponent
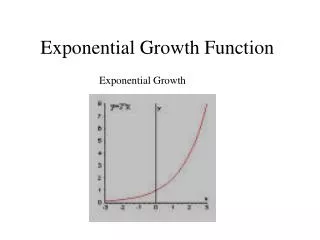
y-intercept: (0, 1) Y = 0 Horizontal Asy: Graph y = 3x What happens at the end of the graph? Y keeps growning as x keeps growing! x y -2 -1 0 1 2 3-2 = 1/9 3-1 = 1/3 30 = 1 y-intercept at 1 31 = 3 32 = 9 Curve NEVER crosses the x-axis!!
label: y-intercept: horizontal asymptote: ends of the graph: Graph y = 3(2)x x y -2 -1 0 1 2 3(2)-2 = 3/4 3(2)-1 = 3/2 y-intercept at 3 3(2)0 = 3 3(2)1 = 6 3(2)2 = 12 Curve NEVER crosses the x-axis!!
Which exponential function is graphed here? • y = 2x • y = 5x • y = 2(0.5)x • y = 2(5)x y-intercept at 2 y = b • ax y = 2 • 5 x a > 1
label: y-intercept: horizontal asymptote: ends of the graph: Graph y = .5(4)x x y -2 -1 0 1 2
Warm-up 10.2 Which exponential function is graphed here? • y = ( ½ )x • y = 5x • y = 3(0.25)x • y = 2(3)x
Lesson 10.2 Objective: I can: - Identify Exponential decay situations - Graph Exponential Decay Functions
Example of expon decay • Each year the local country club sponsors a tennis tournament. Play starts with 128 participants. During each round, half of the players are eliminated. How many players remain after 5 rounds?
Example of expon decay • The pesticide DDT was widely used in the United States until its ban in 1972. DDT is toxic to a wide range of animals and aquatic life, and is suspected to cause cancer in humans. The half-life of DDT can be 15 or more years. Scientists and environmentalists worry about such substances because these hazardous materials continue to be dangerous for many years after their disposal.
label: y-intercept: horizontal asymptote: ends of the graph: Ex 4: Graph y = ( 1/3 )x x y -2 -1 0 1 2 ( 1/3 )-2 = 9 ( 1/3 )-1 = 3 y-intercept at 1 ( 1/3 )0 = 1 ( 1/3 )1 = 1/3 or .33 ( 1/3 )2 = 1/9 or .11 Curve NEVER crosses the x-axis!!
Example 5 (Your turn) Graph y = 2( 1/2 )x x y -2 -1 0 1 2 2( 1/2 )-2 = 8 2( 1/2 )-1 = 4 y-intercept at 2 2( 1/2 )0 = 2 2( 1/2 )1 = 1 2( 1/2 )2 = ½ or .5 label: y-intercept: horizontal asymptote: ends of the graph:
Your turn :Graph the following together y = 2x y = (1/2)x Hint: you might want to graph each individually first
Your turn :Take a Look… y = (1/2)x y = 2x What do you notice about the equations when the graphs are mirror images? The growth factors are reciprocals!
Warm-up (Hint: not all answer will be used) • Which equations below model exponential growth? • Which equations model exponential decay? A. E. F. B. H. • y = 1x • y = 2.5(0.2)x • y = 3x2 • y = 4x • y = 3(0.6)x • y = -5x • y = 3x • y = ½ (8x) • y=10x
Lesson 10.3 Day 1 Objective: I can: - Solve problems involving exponential growth
General Growth Formula b a x y = b = initial amount a = growth factor x = time •
Example #1 The population of a certain strain of bacteria grows according to the formula y = b(2)x, where x is the time in hours. If there are now 50 bacteria, how many will there be in 2 days (48 hours)? y = b • a x y = 50 • 2 48 y = 1.41 x 10¹⁶ ≈ 14,100,000,000,000,000
Example #2 If the number of rabbits in a cage quadruples (x4) every year, how many will be in the cage after 6 years if you start out with 2? y = b • a x y = 2 • 4 6 y = 8,192
Percentage Growth Formula x y = b = initial amount r = % growth (as a decimal) x = time b (1 + ) r
Example #3 In 2004, the number of weekly passes sold by Tri-Cities Transit was 98,481 and was growing at a rate of 3.8% per year. At this rate, estimate the number of passes sold in 2007. y = b(1 + r)x 3 y = 98481 (1 + ) .038 y = 98481(1.038)3 y = 110,139
Example #4 In 2001, the population of Lagos, Nigeria was about 7,998,000. Use the population growth of 4.06% per year to estimate the population in 2009? y = b(1 + r)x 8 y = 7998000 (1 + ) .0406 y = 7998000(1.0406)8 y = 10,996,436
Lesson 10.3 Day 2 Objective: I can: - Solve problems involving exponential Decay!
Percentage Decay Formula x y = b = initial amount r = % decay (as a decimal) x = time b (1 - ) r
Words that mean decay (get smaller): • Depreciates • Decrease • Less
Example # 5 In 2004, the population of Australia was decreasing by 0.8% each year… (a) Find the growth factor, a. (b) The 2004 population was 17,800,000. What is the projected population for the year 2010? y = b ( 1 – r ) x y = ( 1 – ) 17,800,000 0.008 6 y = ( 0.992 ) 17,800,000 6 (a) (b) 0.992 16,962,507
Example # 6 You bought a car for $28,500 in 2005. What is the value of the car in 2008 if it depreciates at 13% each year? y = b ( 1 – r ) x y = ( 1 – ) 28,500 0.13 3 y = ( 0.87 ) 28,500 3 $ 18, 767
Half-Life Formula The half-life of a compound is a measurement of how long it takes for one half of the compound to break down. The formula for half-life looks like this: y = b ( .5 ) x b = Initial Amount of the Compound x = Number of Half-Life Periods *** NOT the Half-Life ***
Example # 7 An isotope of Cesium-137 has a half-life of 30 years. If you start with 20 mg of the substance, how many mg will be left after 90 years? How many after 120 years? = 3 half-lives! = 4 half-lives! y = b ( .5 ) x y = ( .5) 20 3 y = ( .5 ) 20 4 y = 1.25 mg y = 2.5 mg
Example # 8 Radium-226 has a half-life of 1,620 years… (a) Write an equation for the amount of Radium remaining if you start with 4 mg and x number of half-lives have passed. (b) If you begin with 4 mg, how much will be left after 4860 years? y = b ( .5 ) x y = ( .5 ) 4 3 (a) (b) y = 4(.5)x 0.5 mg