Download
1 / 53
530 likes | 564 Views
This paper by Ronald Lee and Andrew Mason explores the economic consequences of demographic transition, focusing on the effects of investment in human capital on fertility rates and economic growth. The research is based on National Transfer Accounts data from 19 countries between 1994-2005, analyzing the relationship between human capital investment, fertility rates, and labor income. The study highlights the impact of education and healthcare expenditures on human capital formation and its implications for population aging, saving rates, and capital intensity. The findings suggest a potential causal relationship between declining fertility rates and increased investment in human capital, impacting economic development over the demographic transition.

E N D
Fertility, Human Capital, and Economic Growth over the Demographic Transition Ronald Lee, University of California - Berkeley Andrew Mason, University of Hawaii and the East-West Center Research funded by NIA National Transfer Accounts
Paper presented at PAA • Should be on NTA website soon National Transfer Accounts
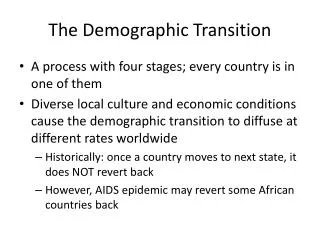
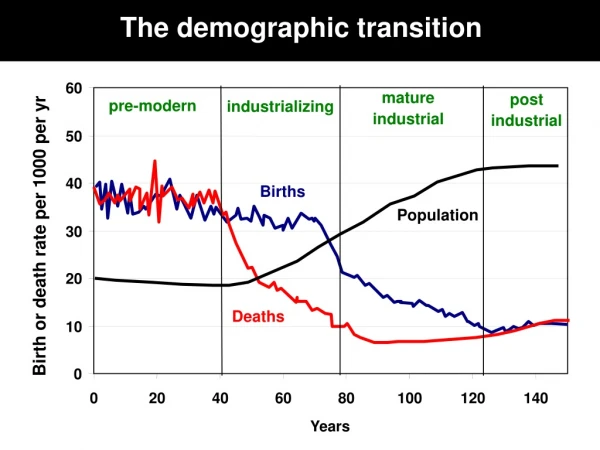
Economic consequences of demographic transition • Support ratios change. • First dividend • Population aging • Aggregate demand for wealth rises leading to more capital per worker. • Second dividend • Lower mort, fewer kids, more elderly who hold assets. • Third: Investment in human capital rises??? • Subject of this paper National Transfer Accounts
Population aging Declining saving rates, rising capital intensity The issue here: Could investment in human capital lead to a similar outcome? First Dividend High saving, rising capital intensity National Transfer Accounts
Starting point is an empirical observation based on National Transfer Account data • Data for 19 countries for various years, poor and rich, 1994-2005. • Measure public and private expenditures on health and education at each age. • Sum these for health ages 0-18 • Sum for education ages 0-26 • Gives total HK investment per child National Transfer Accounts
This is not usual measure of investment in HK • Usually, people look just at education. • Direct expenditures on education are not taken into account at all. • Emphasis is on the opportunity cost of the time spent by a child or young adult getting an education • The rate of return to this investment can be easily estimated from a simple earnings equation. National Transfer Accounts
Can invest more in HK at the extensive margin by going to school for more years • Can invest in HK at the intensive margin by studying harder each year, and spending more each year. • Getting private tutoring after public school. • Going to cram school after public school. • Investment at intensive margin would not show up in standard measure. National Transfer Accounts
Measure labor income by age • Average males and females, including those who have zero labor income at each age. • Include • wages and salaries, • fringe benefits, • self employment income, • estimated unpaid family labor • Form average for ages 30-49 = w. • Construct ratio of HK spending to average w. • Plot log of HK/w against log of TFR. National Transfer Accounts
y = -1.0493x + 1.9233 R2 = 0.6238 National Transfer Accounts
Now calculate total HK spending on all children • Multiply TFR times HK per child, and plot its log against log(TFR). National Transfer Accounts
Average ln(HK spending) is 1.9 Exp(1.9) = 6.7 So couple spends 6.7 years worth of labor income out of their total labor income of 80 years 6.7/80 = .084. About 1/12 of life time labor income is spent on HK for all children. National Transfer Accounts
Now look at this by components National Transfer Accounts
How is this related to standard Quantity-Quality models? • Assume that the share of total labor income spent on HK is fixed, consistent with scatter plot. • Draw budget constraints for differing levels of income. National Transfer Accounts
With same data, plot ln(HK/w) instead of HK, against ln(TFR) instead of n. The budget lines collapse onto a single straight line. National Transfer Accounts
d is HK expenditure expressed in years of work at rate w Slope (elasticity) = -1 Quite similar to empirical scatter Intercept of scatter indicates years of work expended on HK is 6.8. Share of lifetime labor income is 1/12. National Transfer Accounts
So our scatter plot shows a common transformed budget constraint with different fertility-HK choices. • Differing incomes is one possible cause of different fertility choices. • There are many others. National Transfer Accounts
Other sources of variation in fertility/HK choice • Pref for HK: Rate of return to HK; survival rates; consumption value of HK. • Price of HK due to medical technology, transportation improvements, etc. • Price of number: family allowances, fines for second child, changing access to effective contraceptives • Cultural influences on varying share of income allocated to total HK expenditures and on number. National Transfer Accounts
Association is non-causal • We don’t know whether fertility decline causes rising HK investments per child. • Desire to make bigger HK investments causes fertility decline. • Some other factor causes both fertility and HK changes. National Transfer Accounts
To estimate a causal relationship we would need to have some way of isolating an independent cause of fertility variation, and then look at the HK variation. • Possibilities at micro level • Whether first two births are daughters, for countries with son preference • Twins • Sterility due to disease, after some births. • Access to contraception in area • Other ideas? National Transfer Accounts
Here we need at national level • Paper by Bloom, Canning, et al uses abortion laws of country • Access to contraception in a country is another possibility, but less clear that it is exogenous. • Any ideas? National Transfer Accounts
Now we are going to develop a simple model. • Goal is to simulate the effects of fertility and mortality change over the transition on HK investment. • Combine this with other estimates of effect of HK on wages. National Transfer Accounts
Model—basic structure • Take fertility variations as given, trace out consequences for HK, w, consumption. • 3 generations: children, workers, retirees; usual accounting identities. • No saving or physical capital. National Transfer Accounts
Notation • Ht is the human capital of generation t • Ft is the NRR of generation t, so it includes survival from birth to working ages. • Wt is the wage of generation t. National Transfer Accounts
Basic fertility-HK relations • The last equation shows how wages for one generation result from the wages of the generation’s parents and their fertility. • Given fertility over the demographic transition, and initial wage level, we can trace out the trajectory of wages. National Transfer Accounts
Constant elasticity functions are a special case • The earlier analysis suggested α = 1/12 = .083 β = -1 From other literature, δ = .33 (maybe) γ doesn’t matter in this formulation National Transfer Accounts
Production and Human capital Baseline Specifications • Human capital (HK) • Portion of wage, W(t), workers invest in their children is inversely related to their fertility, F(t) • Human capital of workers one period later is • HK(t+1) = h(F(t)) W(t) • Wage (W) • Wage is increasing in human capital • W(t) = g(HK(t)) National Transfer Accounts
That .33 comes reviewing a large literature on micro level estimates of earnings in relation to education, and a smaller macro level literature on aggregate production functions that include the education of the labor force, usually median education or proportions enrolled. National Transfer Accounts
Equilibrium wage when fertility is constant • Given those parameter values, this tells us that the equilibrium wage is inversely proportional to the square root of the constant level of fertility, F.5. National Transfer Accounts
Linking fertility and wages to the aggregate economy • Demography notation • Let N0t be number of children • N1t be number of working age • N2t be number of elderly • F = NRR, so survival from birth to wrking age is included. • s = survival from working age to old age • Equations • N1t+1 =F*N1t • N2t = s*N1t National Transfer Accounts
Total output T • Tt = Wt*Nt • We can derive many analytic results for T, W and F, but instead we will go on to consider consumption. National Transfer Accounts
Get consumption by stubtracting from total wages the amount spent on human capital investment • The amount consumed is • The share of aggregate production T that is consumed is • In our constant elasticity special case, this becomes: National Transfer Accounts
Now get consumption per equivalent adult consumer • Take expression for Ct from the previous slide. • Divide it by population weighted by equivalent adult consumers, e.g. from NTA c(x) schedules. • This gives ct National Transfer Accounts
Simulation results for steady state • Fixed fertility leads to steady-state with • Constant wage and HK • GDP grows at the same rate as the population. • Consequences of different fixed level of fertility under baseline assumptions. • Lower fertility leads to a higher steady-state wage, GDP/N, and consumption per equivalent adult (C/EA). • Population aging goes with higher consumption, not lower. • However, if fertility-HK-productivity links are weaker than baseline, then: • relationship between TFR and consumption can be hump shaped with a maximum at an intermediate fertility level. • Thus, under some circumstances there is an optimal level of fertility as Samuelson conjectured. National Transfer Accounts
Dynamic simulations • Now assume a stylized fertility transition going to sub-replacement fertility and then recovering to replacement level. • Simulate consequences for consumption per equivalent adult. National Transfer Accounts
Boom (demoraphic dividend) Fertility bust, but consumption remains high Fertility recovers: modest effect on C/EA Bottom line: Low fertility leads to higher consumption. Human capital investment has moderated the impact of fertility swings on standards of living. National Transfer Accounts
During first dividend phase, consumption does not rise as much as support ratio. The difference is invested in HK. That is why ih later periods, consumption is proportionately higher than the support ratio. National Transfer Accounts
Key Findings • Strong tradeoff between fertility and human capital investment. • Given plausible parameters • Lower fertility leads to higher standards of living • Swings in support ratio do not lead to swings in standards of living National Transfer Accounts
Qualifications • Parameter estimates quite uncertain • Literature on impact of human capital investment on economic growth is unsettled. • NTA-based estimates on HK:TFR relationship is preliminary and based on fewer than 20 countries • Model is highly stylized and abstracts from many important details. National Transfer Accounts