Download
1 / 52
520 likes | 547 Views
This study by Randolph Watts and team at the University of Rhode Island focuses on characterizing the drift of Paroscientific pressure sensors, presenting a reliable method for geostrophic leveling and drift detection. Different drift curves are analyzed using Digiquartz sensors. The research covers CPIES arrays, deep circulation mapping, and dedrifting methods. Findings show the suitability of exponential and linear curve fitting to represent drift, aiding in pressure sensor improvements and data accuracy.

E N D
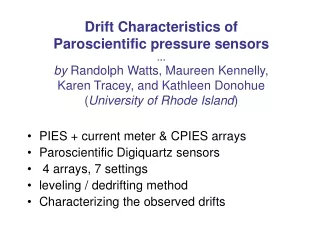
Drift Characteristics of Paroscientific pressure sensors…by Randolph Watts, Maureen Kennelly, Karen Tracey, and Kathleen Donohue (University of Rhode Island) • PIES + current meter & CPIES arrays • Paroscientific Digiquartz sensors • 4 arrays, 7 settings • leveling / dedrifting method • Characterizing the observed drifts
Drift Characteristics of Paroscientific pressure sensors • Aim to show… • (exponential+linear) curve is well suited to represent the drift • Geostrophic leveling & drift detection is reliable to ~0.01 dbar • new drift curves differ from previous method that used just P data, although both use (exp + lin) fit • Averaging records from two or more ‘same-site’ sensors produces an average drift, but not zero drift • Pre-stressing reduces |drift|
CPIES: current and pressure recording inverted echo sounder Measures bottom current. (50 m off bottom) Emits 12kHz sound pulses. Measures round trip travel times of acoustic pulses to sea surface and back. Measures bottom pressure (and temperature). (includes acoustic release + relocation radio+strobe light)
A CPIES array yields daily maps of upper and deep circulation. Look-up tables interpret acoustic travel times as geopotential height (0 referenced to 5000 dbar). 2-D arrays of CPIES estimate horizontal gradients of geopotential to calculate geostrophic velocities. Velocity profiles are referenced by measured near-bottom currents. Bottom pressures are leveled using near-bottom currents to map the geostrophic streamfunction. CPIES array yields…
Digiquartz sensor- Paroscientific website • Digiquartz frequency increases with pressure-applied load: • Accuracy 100 ppm; drift ~ 10 ppm; stability & resolution ~ <1-2 ppm • PIES measures frequency with 4MHz temperature-compensated crystal • freq. spec: 10 ppb accuracy to serve as a stable reference
URI PIES & CPIES deployment sites • 4 recent arrays with current meters; 7 settings
URI PIES & CPIES deployment sites • 4 recent arrays with current meters; 7 settings Kuroshio Extension Gulf of Mexico Kuroshio, East China Sea Drake Passage
Gulf of Mexico arrays ofPIES & CMs … combined to level the pressure sensors geostrophically Drake Passage Kuroshio Extension
Detide detide Tidal response analysis (Munk and Cartwright, 1977) determines the tidal constituents for each instrument. Tides are then removed from the pressure records.
Kuroshio Extension deep streamfunction mapsLP filter (1-mo); July-Aug 2004 These are used to level and dedrift the P(t) records as follows.
Leveling (and drift) • The streamfunction from CMs and the pressure from PIES measure the same geostrophic pressure field. • The two fields should only differ by a site-dependent leveling constant.
drift-curve fit to P(t) - Pcm(t) • Examples from KESS sites • 31-d lowpass filter p & pcm • Difference (p-pcm) is due to mapping-error and drift
drift-curve fit to P(t) - Pcm(t) • Examples from KESS sites • 31-d lowpass filter p & pcm • Difference (p-pcm) is due to mapping-error and drift • Fit exponential+linear to the difference • Residual rms<0.01 dbar • Resid slope<0.005dbar/yr
drift-curve fit to P(t) - Pcm(t) • Examples from KESS sites • 31-d lowpass filter p & pcm • Difference (p-pcm) is due to mapping-error and drift • Fit exponential+linear to the difference • Residual rms<0.01 dbar • Resid slope<0.005dbar/yr • Old method fit (exp+lin) to hourly data (dotted line), w/o geostrophic leveling could differ by 0.03-0.05 dbar
Digiquartz Pressure Drift (1) • How well-suited is the (exponential + linear) curve-fit to the ‘processes’ causing observed drifts? • Test by comparing ‘same-site’ differences of raw records against the sum of fitted drift curves • Note ‘same-site’ pairs could be 0.1 to 0.4 km apart
Consistency of method at ‘same-site’ pairs in GoMex • (rows 1, 2) sites with two PIES each, separately dedrifted • (row 3) The difference between raw records (blue) agrees with difference between drift curves (red); rms <0.0013 dbar (model 46K’s)
Consistency of (exp+lin) at ‘same-site’ pairs in Kuroshio • (rows 1, 2) Two sites with two PIES each, separately dedrifted • (row 3) The difference between raw records (blue) agrees with difference between drift curves (red); rms=0.004, 0.002 dbar (model 410K’s)
The (exp + lin) curve suits the drift process well • Next simply characterize the drift of each of many records by its (exp + lin) curve…
144 drift curves from 92 sensors +0.1 dbar/yr ref slope
Digiquartz Pressure Drift (2) • 6000 psi ~ 4000 dbar sensors, model 46K • 10000 psi ~ 6800 dbar sensors, model 410K • Do drifts scale with FS range? • What sign and magnitude of drift?
Model 46K and 410K sensor drift 46K’s - all pre-stressed 410K’s - mixed pre-stressing
Model 46K (stretched) and 410K sensor drift 46K’s, vertical scale X (10/6) -Slightly less drift, but the improvement may have arisen from pre-stressing 410K’s - mixed pre-stressing 46K’s - all pre-stressed
Typical |drift| ~ 0.4 dbar • Upward and downward drifts would arise from two different processes • Exponential and linear drifts would arise from different processes • So there must be at least 3-4 substantial contributions to drift • Yeow!
Digiquartz Pressure Drift (3) • Since the largest part of the drift decays exponentially with time, can pre-stressing the sensors decrease subsequent drift? • We usually pre-stress for many weeks or months • 4000 psi for 6000 psi FS (~2800 dbar for ~4000 dbar FS) • 6000 psi for 10000 psi FS (~4100 dbar for ~6800 dbar FS) • How much might it help to pre-stress at nearly the same pressure as the subsequent deployment? • Does sensor improve with age?
How effective is pre-stressing? (410K’s) • Without pre-stressing, all six |drifts| ~ -.4 dbar in a year • With pre-stressing many |drifts| <0.1 dbar (+/-) in a year, • but many others drifted up or down ~0.4 dbar in 1-2 yrs • pre-stressing seems highly advisable, but • does not guarantee small drift
How effective is pre-stressing? (410K’s) • Without pre-stressing, all six |drifts| ~ -.4 dbar in a year • With pre-stressing many |drifts| <0.1 dbar (+/-) in a year, • but many others drifted up or down ~0.4 dbar in 1-2 yrs • pre-stressing seems highly advisable, but • does not guarantee small drift Next represent drift as (end-start)…
Does it help to pre-stress at ~ deployment P? Answer maybe… excepting outliers
Does drift depend on prior deployment depth?difference (Pnew - Pprior) • Answer is similarly murky… • Slightly less drift with `same’ new and old deployment depths.
Does age of sensor reduce drift rate? • (1-year) total drift vs. age
Digiquartz Pressure Drift (4) • Does a given sensor drift ‘predictably’ from one deployment to the next?
Digiquartz Pressure Drift (4) • Does a given sensor drift ‘predictably’ from one deployment to the next? • Answer… the drift is not necessarily replicated in magnitude or direction! But we had many variables, and have not yet sorted out all effects. • A few sensors DID replicate drift.
Digiquartz Pressure Drift (5) • If you average two “same-site” pressure records, how well can this approximate a drift-free record? • Test by comparing near-neighbor averages of raw records against the accurately dedrifted curves • Near-neighbors could be 0.1 to 0.4km apart
These 46K sites average very well because they had small drifts that fortuitously opposed each other.
Drift Characteristics of Paroscientific pressure sensors • Summary … • (exponential+linear) fitted curve is well suited to represent the drift, to which 3 or more processes contribute • Geostrophic leveling & drift detection is reliable to ~0.01 dbar • New drift curves differ from previous method of fitting data, although both use (exp + lin) fit • Averaging records from two or more ‘same-site’ sensors produces an average drift, but not zero drift • Pre-stressing reduces |drift| (usually) < 0.10 dbar / yr • Small net drift helps reduce uncertainty in fitted drift curve • Aged sensors improve like good wine • Drift of a given sensor is not predictable from one deployment to the next • Choose a low range sensor (when possible) to achieve smaller drift
144 drift curves from 92 sensors +0.1 dbar/yr ref slope
A CPIES array yields daily maps of upper and deep circulation. Look-up tables interpret acoustic travel times as geopotential height (0 referenced to 5000 dbar). 2-D arrays of CPIES estimate horizontal gradients of geopotential to calculate geostrophic velocities. Velocity profiles are referenced by measured near-bottom currents. Bottom pressures are leveled using near-bottom currents to map the geostrophic streamfunction. CPIES array yields…
Leveling flowchart LEVELING PRESSURE GAUGE WITH DEEP CURRENT METERS Pre-stress pressure gauges Detide pressure Current at CMs Dedrift pressure Mean pressure Mean current Leveled pressure constants
Pre-stress gauges Pre-stress gauges Experience has shown that pressure drift is greatly reduced by preconditioning. Sensors are subjected to pressures of 3000 dbar for 1-2 months in the lab.
Mapping flowchart Current at CM sites Leveled p Mean p and current maps Mean p at PIES sites Mean current at CM sites p anomaly Current anomaly p and current anomaly maps Daily p and current maps
Leveling (and drift) • The streamfunction from CMs and the pressure from PIES measure the same geostrophic pressure field. • The two fields should only differ by a site-dependent leveling constant. • Other differences arise from error in OI mapped streamfunction and drift in the pressure sensor. • The sensor drift is detected by the difference from the temporal record of geostrophic pressures • The drift is represented by a decaying exponential plus linear curve, least-squares fitted to this difference
Consistency of (exp+lin) at ‘same-site’ pair in Kuroshio(2) • (rows 1, 2) Another site with two PIES, separately dedrifted • (row 3) The difference between raw records (blue) agrees with difference between drift curves (red); rms <0.005 dbar (model 410K)
Is drift smaller in 2nd/3rd deployment? 46K’s 410K’s 1st 2nd 3rd
Subsequent depth shallower/ same/ deeper shallower same depth +/- 500m -0.1 dbar/yr • 410K’s drifts are mixed • Shallower 46K’s drift to higher P • or “flat” • Deeper 46K’s drift to lower P • or nearly “flat” • Same-depth 46K’s - slightly better? deeper
Does drift depend on prior deployment depth?difference (Pnew - Pprior) • Slightly less drift with `same’ new and old deployment depths.