Download

1 / 26
260 likes | 287 Views
Explore the historical shifts in federal spending, revenue sources, taxation structures, and the changing composition of government expenses in the U.S. over time. Understand the impact on economic dynamics and income distribution.

E N D
Government Spending and Taxation 1 6 1 4 1 5
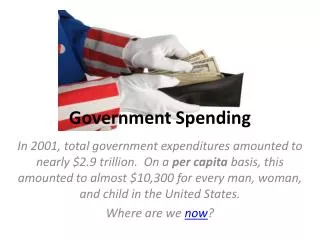
Growth of Government • During the first 125 years of U.S. history, federal expenditures per person were small and they grew at a relatively slow rate.(See following slide) • In contrast, federal spending soared throughout most of the 20th century. In 2008, real federal spending per person was roughly 70 times the level of 1916. • During the 1990s per capita real federal spending was relatively constant. In fact, it declined slightly during the decade. • Since 2000, per capita real federal spending has once again been increasing rapidly.
Real Federal Expenditures Per Capita:1792-2008 Real federal spending per person(in 2000 U.S. dollars) $ 8,000 $ 7,000 $ 6,000 $ 5,000 $ 4,000 $ 3,000 $ 2,000 $ 1,000 1800 1850 1900 1950 2000 • Real federal spending per person (measured in 2000 dollars) grew slowly during the first 125 years of U.S. history, but it soared throughout most of the 20th century.
Changing Nature of Government • During the last four decades, federal spending has shifted away from national defense and toward spending on income transfers and health care. • In 2008, national defense accounted for only 21.0% of the federal budget, down from 52.2% in 1960. • In contrast, spending on income transfers and health care rose from 21.5% of the federal budget in 1960 to 57.7% in 2008.
58 % 57 % 52 % 44 % 44 % 42 % 30 % 24 % 23 % 22 % 21 % 17 % Health & income transfer expenditures(share of federal spending) Defense expenditures(share of federal spending) Health care Income transfers The Changing Composition of Federal Spending 1960 1970 1980 1990 2000 2008 1960 1970 1980 1990 2000 2008 • During the last four decades, federal spending has shifted sharply away from national defense and toward income transfers and health care.
Taxes and the Finance of Government
Taxes and Other Revenue Sources • Governments are financed by taxes, user charges, and borrowing. • Borrowing implies higher future taxes. • The power to tax is a distinguishing characteristic of government. • The major sources of federal revenue are the personal income tax (accounted for 45.4% of federal revenue in 2008) and the payroll tax (accounted for 35.7% of the total in 2008). • Major revenue sources at the state and local level are sales and excise taxes, personal income taxes, user charges, and grants from the federal government.
User charges 19.7% Property 13.1 % Personal income45.4% Payroll35.7% Interestearnings2.6% Personalincome 9.8% Sales & excise 15.1% Corporateincome 1.9% Other3.0% Customs duties 1.1% Excise2.7% Other 21.3% Corporateincome 12.1% From Federalgovernment 16.5% Federal government revenue2008 -- $ 2,524 billion State & local government revenue2006 -- $ 2,737 billion Sources of Government Revenue
Taxes and the Cost of Government • A dollar of taxation costs the economy more than a dollar because: • It is costly to administer, enforce, and comply with tax legislation. • Taxes distort incentives and eliminate productive exchanges (and cause people to undertake some counterproductive activities). • Economists refer to this as the “dead weight loss” of taxation.
How Has the Structure of the Personal Income Tax Changed? • The share of the income tax paid by high-income taxpayers has risen during the past 40 years – especially since 1980. (This is demonstrated graphically on the next slide.) • Why has the share paid by those with high-incomes risen? • The decline in marginal tax rates has created greater “incentive effects” for high-income tax payers to earn taxable income. • The standard deduction and personal exemption have increased substantially over the past two decades.
Share of Federal Income Taxes Paid By Various Income Groups Share of total federalpersonal income tax paid Income group 1963 1980 1990 2006 Top 1% 18.3 % 19.1 % 25.1 % 39.9 % Top 5% 35.6 % 36.8 % 43.6 % 60.1 % 47.0 % 49.3 % 55.4 % 70.8% Top 10% Top 25% 68.8 % 73.0 % 77.0 % 86.3% Top 50% 89.6 % 93.0 % 94.2 % 97.0% Bottom 50% 10.4 % 7.1 % 5.8 % 3.0% • Upper-income Americans pay the bulk of the federal income tax and the share they pay has risen during the last 4 decades.
25.5 % 17.4 % 14.2 % 9.9 % 4.3 % Total Federal Taxes As a Share of Income, 2005 Federal taxes as a share of income (%) Lowest Second Third Fourth Highest –––– Family income groups –––– (quintiles) • Here we show the payment of federal taxes as a share of income for each income quintile. • Note the overall federal tax structure is highly progressive.
Does the Growth of Income Benefit the Federal Government? • Federal personal income tax brackets are indexed for inflation, but no adjustments are made for increases in real income. • Under the current progressive tax structure, the growth of real income will increase federal revenues as a share of total income if no offsetting action is taken.
Size of Government: U.S. versus Other Countries
Size of Government: U.S. Versus Other Countries • The size of government in the U.S. is smaller than that of Japan and the major Western European countries, but larger than for a number of high-growth Asian economies. (See the following slide.)
Size of Government: An International Comparison Japan 36.1% Government expenditures as a share of GDP, 2007 Sweden 52.8 % France 52.4% Denmark 51.2% Austria 48.4% Belgium 48.2% Italy 48.2% Portugal 45.9% Netherlands 45.3% United Kingdom 44.4% Germany 43.8% Greece 43.7% Norway 40.6% Canada 39.6% Spain 38.8% United States 37.2% New Zealand 36.7% Ireland 35.5% Australia 34.4% South Korea 22.6 % Thailand 20.9% Hong Kong 17.4% Singapore 15.2%
The Size of Government and Economic Growth
The Size of Government and Economic Growth • The core functions of government such as a sound legal system, access to money of stable value, and provision of public goods that are difficult to provide through markets will promote economic growth and help citizens achieve high income levels. • But when government expands beyond these core functions and into areas for which it is ill-suited, it will retard economic growth.
Growth rate of the economy B 6% 3% A Size of government(percent of GDP) Size of Government – Growth Curve • If governments undertake activities in the order of their productivity, the growth of government will initially promote economic growth (move from A to B). • At some point, however, continued expansion of government will retard growth (moves beyond B).
Data are for the 23 long-standing member countries of the OECD Govt Spending and Economic Growth • The relationship between the size of government at the beginning of the decade and the growth rate of real GDP for each decade during the 1960-1999 period is shown below. • An increase in government spending of 10% (as a share of GDP) reduces annual growth by about 1%. Growth rate(respective decade) 10 % 8 % 6 % 4 % 2 % 0 % 10 % 20 % 30 % 40 % 50 % 60 % Total government expenditures (start of respective decade) Source:OECD, OECD Economic Outlook (various issues)and The World Bank, World Development Indicators, 2001, CD-ROM.
The Future of Government Spending in the United States • A major share of U.S. government spending (e.g. Social Security & Medicare) is directed towards the elderly. • As the baby-boom generation begins to retire around 2010, federal expenditures are almost certain to grow as a share of the economy. • In turn, the higher level of government spending is likely to slow the growth rate of the economy.
Questions for Thought: 1. A century ago, federal taxes and spending per person were substantially lower than today. How would the U.S. economy be affected if the federal government was, for example, one-third its current size? What programs would you favor cutting? 2. Because the structure of the personal income tax is progressive, more income is taxed at higher rates as income grows. Therefore, economic growth automatically results in higher taxes. Do you think this is an attractive feature of the current tax system?
Questions for Thought: 3. The marginal tax rates imposed on those with high incomes are now substantially lower than in 1980. Would you like to see higher tax rates imposed on high income Americans? Do you think higher rates would increase the tax revenues collected from high-income Americans? 4. “Real federal spending per person grew slowly under the Reagan Administration during the 1980s, but it increased rapidly under the Clinton administration in the 1990s.” -- Is this statement true?
Questions for Thought: • 5. Are the following statements true or false? • a. During the first 125 years of U.S. history, federal expenditures per person were small and they grew at a relatively slow rate. • b. In 2006, real federal spending per person was about 70 times its level of 1916.