Download
1 / 20
200 likes | 224 Views
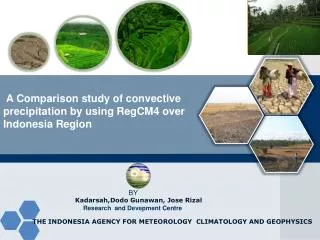
This study evaluates convective precipitation using space-borne radar data to assess the accuracy of water substances modeling in convection schemes, impacting global circulation. Two space-borne radars, CloudSat and TRMM, were utilized to analyze radar reflectivity and convective precipitation fraction, revealing discrepancies with observation. The study delves into radar reflectivity simulations, convective precipitation fraction estimation, and potential causes of discrepancies between models and observations on convective ice classification and particle size distribution.

E N D
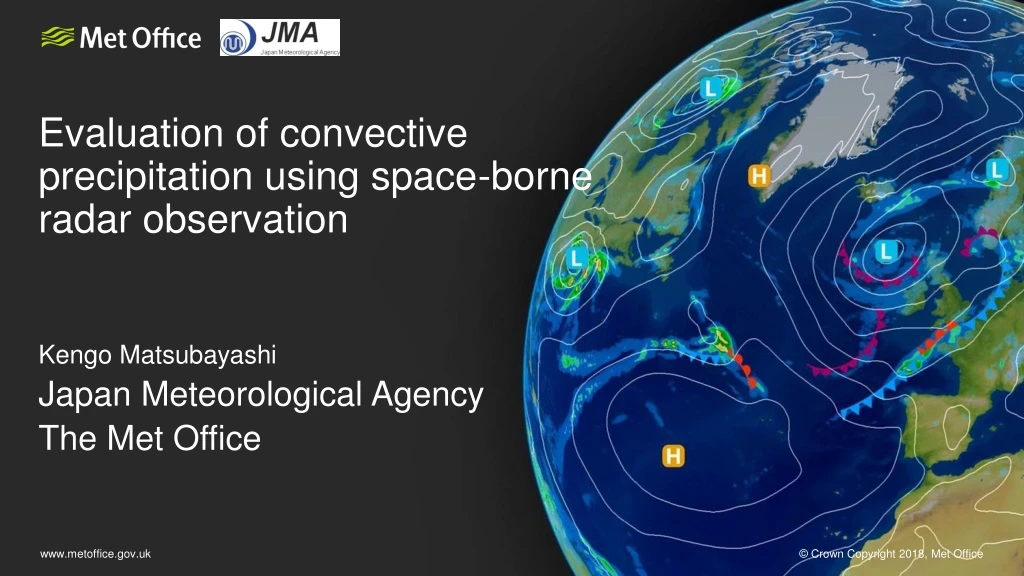
Evaluation of convective precipitation using space-borne radar observation KengoMatsubayashi Japan Meteorological Agency The Met Office
Outline Motivation Observation and evaluation method Evaluation result Summary
Motivation • In many convection schemes, water substances are empirically modelled. • Evaluation of water substances in convection schemes is important because of its latent heat release, evaporation and water loading directly influence the global circulation. • In this study, as a proxy of direct evaluation of vertical profile of convective precipitation in convection schemes, radar reflectivity is evaluated using satellite-based radar observation.
Two space-borne radars 2B-GEOPROF P1_R05 2APR Version 06A In this study, 2 kinds of space-born radar observation, CloudSat CPR and TRMM PR, are used. These 2 radars have different characteristics, so using two radars helps understanding what causes discrepancies between models and observation.
Two space-borne radars While CloudSat CPR has higher horizontal resolution, TRMM PR has wide swath and can observe the horizontal distribution of convection.
Two space-borne radars TRMM PR CPR strongly attenuates by large particles (>1mm) in heavy precipitation, whereas PR can observe heavy precipitation. CloudSat CPR
Two space-borne radars CPR has high sensitivity and can detect very weak echoes by cloud with small particles (e.g. cirrus), on the other hand PR cannot detect weak echoes.
Simulation of radar reflectivity How do we assign convective precipitation to subcolumns? We have to diagnose convective precipitation fraction(CPF) which is the area fraction convective rain precipitate in a model grid. • Unified Model AMIP run • ~208km*139km@Equator • COSP(Bodas-Salcedo et al.2011) • Split the model grids into sub-columns • Assign large-scale condensation considering cloud overlapping in a consistent manner to radiation scheme. • Estimate convective water substances from precipitation flux using particle size distribution(PSD) and terminal velocity, and assign to subcolumns. • Calculate vertical profile of radar reflectivity based on PSDs in each sub-columns.
Convective precipitation fraction(CPF) estimation Using TRMM PR observation, the relation between CPF and grid-box mean convective precipitation is investigated. If CPF has correlation to grid-box mean convective precipitation, CPF can be estimated using grid-box mean convective precipitation which convective scheme predicts. The relation derived from TRMM PR looks to have correlation, but has large spread. So, we handled CPF stochastically depending on convective precipitation amount. We produced PDF of CPF using TRMM PR observation in advance, and simulated the probability of radar reflectivity occurrence using the PDF.
Radar detection frequency (N40-S40) CloudSat CPR(>-27.5dBZ) TRMM PR(>18dBZ) Obs Mdl Simulated radar detection well corresponds to observation, but there are several differences. In the tropics(N20-S20), simulated CPR and simulated PR over 5km has too infrequent detection compared to observation.
Reflectivity-Altitude joint histogram(N20-S20) CloudSatCPR TRMM PR There are two large differences between the observations and simulated fields. Radar reflectivity over 5km, which is expected to be ice, is too weak in simulated. Radar reflectivity in lower layer is too infrequent compared to observations. Obs Mdl
Reflectivity-Altitude joint histogram(N20-S20) CloudSatCPR TRMM PR Radar reflectivity over 5km, which is expected to be ice, is too weak in simulated. Wrong ice category classification? In the radar reflectivity simulation, convective ice are assumed to be snow aggregates. If this discrepancy is caused by graupel/hail, which have large diameter, PR radar reflectivity should be stronger and CPR reflectivity should be strongly attenuated. Obs Mdl
Reflectivity-Altitude joint histogram(N20-S20) CloudSatCPR TRMM PR Radar reflectivity over 5km, which is expected to be ice, is too weak in simulated. Wrong particle size distribution? We tried other ice PSDs (e.g. Gunn and Marshall, Sekhon and Srivastava), there was not much difference. Obs Mdl
Reflectivity-Altitude joint histogram(N20-S20) CloudSatCPR TRMM PR Radar reflectivity over 5km, which is expected to be ice, is too weak in simulated. Too few ice? The current convection scheme in UM employs a constant threshold to determine the amount of water substance to fall out from updraft. However, actually it should depend on vertical velocity. Much more ice with large diameter may be carried to upper layer. Obs Mdl
Reflectivity-Altitude joint histogram(N20-S20) CloudSatCPR TRMM PR Radar reflectivity in lower layer is too infrequent compared to observations. Weak (and shallow) convection could be too infrequent in the model. The frequency of the convection scheme triggering is too low compared to observations. Obs Mdl
CloudSat CPR CFAD Observation Model To see the convective precipitation in detail, extract cloud with cloud base height is lower than 3km. Congestus can be seen in both observations and simulated data above ~5km. Although observed congestus reaches ~7km, congestus predicted in the model is lower than observations and its height is too concentrated. This may be due to the lack of the representation of overshooting in the convection scheme.
Summary As a proxy of direct evaluation of convective precipitation, radar reflectivity evaluation with stochastic convective precipitation fraction has been developed. Radar reflectivity evaluation using 2 radar observation revealed several discrepancies. Too weak reflectivity over 5km Less frequent convective precipitation in low layer Too low congestus As a next step, we are going to evaluate the new convection scheme called CoMorph which is being developed at the Met Office.
Questions? kengo.matsubayashi@metoffice.gov.uk