Evidence-based librarianship
790 likes | 803 Views
Evidence-based librarianship. Dr. Ali Rashidi. کارگاه آشنايی با مبانی و شاخصهای علمسنجی. دکتر علی رشیدی. Not All Science is the Same. Good Science. Bad Science. Dead end Papers which end in the trash Electronic documents lost in cyberspace.

Evidence-based librarianship
E N D
Presentation Transcript
Evidence-based librarianship Dr. Ali Rashidi
کارگاه آشنايی با مبانی و شاخصهای علمسنجی دکتر علی رشیدی
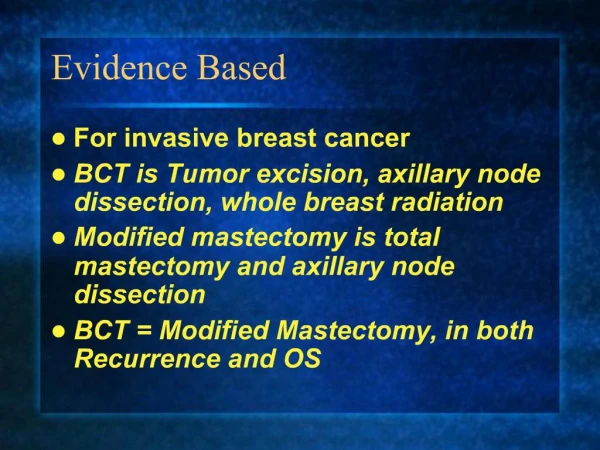
Not All Science is the Same Good Science Bad Science • Dead end • Papers which end in the trash • Electronic documents lost in cyberspace • Improved diagnosis, treatment • Understanding of disease • Wealth generation • Progress in general Roberto Romero, AJOG, 2016.
The science of ‘trashing’ a paper Unoriginal Unimportant issue Hypothesis not tested Badly written Different type of study required Conflict of interest Compromised original protocol Unjustified conclusion Poor statistics Sample size too small
Why do we evaluate scientific output • Grant Allocations • Policy Decisions • Benchmarking • Promotion • Collection management • Funding allocations • Research • Hiring • Making the right investment International National Institutional Faculty SPLIT IN NEEDS SPLIT IN NEEDS Researchers
Bibliometrics The application of mathematics and statistical methods to assess science as an informational process Nalimov VV, Mulchenko BM. Measurement of science: study of the development of science as an information process. Washington, DC: Foreign Technology Division, 1971
Measuring Productivity in Science • Option 1: Number of papers published • This matrix emphasizes quantity (vs. quality) • What if most of papers are not important or have no influence in science or medicine? • Option 2: Attempt to measure quality • Has the paper been cited by others? • Has the paper influenced the field? Roberto Romero, AJOG, 2016.
Why are Citations Important? • “Attention is the mode of payment in science” • “Money is not the main motive for engaging in science” • “Success in science is rewarded with attention” • Citations = attention Franck G. Science 1999; 286,5437:53-55
Conclusion • “Citations are the fee paid through transfer of some of the attention earned by the citing author, to the cited author” Franck G. Science 1999; 286,5437:53-55
Eugene Garfield, PhD • Informational scientist • Proposed citation indices in 1955 • Journal Impact Factor in 1960 • Institute for Scientific Information (ISI) • Journal of Citation Reports • Web of Science/Knowledge • Purchased by Thomson Reuters http://garfield.library.upenn.edu/
Birth of the Science Citation Index Science. 1955;122:108-11
Journal Impact Factor Science. 1972;178:471-9. Science. 1972;178:471-9.
Definition of the Impact Factor of a Journal Total No of “citable items” published in the 2 previous years (e.g. 2013 and 2014) No of citations to all articles published in a particular year (e.g. 2015) Impact Factor = "Citable items" for this calculation are usually original articles or reviews; not Editorials, Viewpoints, Abstracts or Letters to the Editor. Roberto Romero, AJOG, 2016.
ISI Impact Factor A= total cites in 1992 B= 1992 cites to articles published in 1990-91 (this is a subset of A)* C= number of articles published in 1990-91D= B/C = 1992 impact factor
Journal of Citation Reports Journal of Citation Reports
Journal Citation Reports 2014 Journal of Citation Reports
Impact Factor Interpretation • Journals with a high impact factor are considered more prestigious than journals with a lower impact factor • A paper published in AJOG has an average probability of being cited 4.7 times in the next 2 years • Impact Factor: How Many People Read My Article? Roberto Romero, AJOG, 2016.
The Impact Factor Variability and Journal Size 40% 30% 20% 10% Mean Change in IF 06-07 0% -10% -20% -30% -40% <35 >150 35-69 70-150 Journal Size Number of Articles per Year Amin M, Mabe MA. Medicina (B Aires). 2003;63:347-54.
Journal Citation Reports 2014 Journal of Citation Reports
Eigenfactor Score: A Sophisticated Measure of Journal Prestige • A journal's Eigenfactor score is measured as its importance to the scientific community. Scores are scaled so that the sum of all journal scores is 100. In 2006, Nature had the highest score of 1.992. • Percentage of weighted citations received by a journal compared to all 6, 000 journals analyzed from the 2004 Journal of Citation Reports dataset. • Instead of each citation to a journal being counted as 1, each citation received by a journal is instead assigned a value greater or lesser than 1 based on the Eigenfactor of the citing journal Courtesy of David Tempest
Eigenfactor Score • Generally identifies journals that have most impact in their subject areas (Eigenfactor: How Many People Read this Journal?) • Bigger and highly cited journals will tend to be at the top of rankings according to Eigenfactor • Exclusion of journal self-citations in the calculation of the Eigenfactor minimises citation practices of some journals, but will penalize journals that serve small niches • Review Journals are de-emphasised in Eigenfactor score Courtesy of David Tempest
Eigenfactor Score Journal of Citation Reports
Journal vs. Author Roberto Romero, AJOG, 2016.
Professor Jorge E. Hirsch www-physics.ucsd.edu Proc Natl Acad Sci U S A. 2005;102:16569-72.
H-Index • Rates a scientist’s performance based on his/her career publications, as measured by the lifetime number of citations each article receives • Depends on both quantity (number of publications) and quality (number of citations) of a scientist’s publications Roberto Romero, AJOG, 2016.
H-Index • Definition: “A scientist has index h if h of their N papers have at least h citations each, and the other (N – h) papers have no more than h citations each.” • Translation of definition: If you list all of an author’s publications in descending order of the number of citations received to date, their h-index is 10 if at least 10 papers have each received 10 or more citations.
H-index example Author A Author B
H-index example Author X has 5 published articles: Article1, citations 5 Article2, citations 10 Article3, citations 100 Article4, citations 6 Article5, citations 4 The H-index of X is 4: there are 4 papers with at least 4 citations each.
How to Calculate Your H-Index Roberto Romero, AJOG, 2016.
Step 1: Profile https://www.wageningenur.nl
Step 2: Articles https://www.wageningenur.nl
Step 3: Updates https://www.wageningenur.nl
Other Indicators of Journal Prestige:Citation Classics Roberto Romero, AJOG, 2016.
The g-index • Suggested in 2006 by Leo Egghe. • The index is calculated based on the distribution of citations received by a given researcher's publications.
The g-index • G-Index is calculated this way: "[Given a set of articles] ranked in decreasing order of the number of citations that they received, the G-Index is the (unique) largest number such that the top g articles received (together) at least g^2 citations."
i10-Index \ Created by Google Scholar and used in Google's My Citations feature. i10-Index = the number of publications with at least 10 citations. This very simple measure is only used by Google Scholar, and is another way to help gauge the productivity of a scholar. Advantages of i10-Index Very simple and straightforward to calculate My Citations in Google Scholar is free and easy to use Disadvantages of i10-Index Used only in Google Scholar
Field-Weighted Citation Impact Field-Weighted Citation Impact takes into account the differences in research behavior across disciplines. (Connect to SciVal) • Sourced from SciVal, this metric indicates how the number of citations received by a researchers publications compares with the average number of citations received by all other similar publications indexed in the Scopus database. • A Field-Weighted Citation Impact of 1.00 indicates that the publications have been cited at world average for similar publications. • A Field-Weighted Citation Impact of greater than 1.00 indicates that the publications have been cited more than would be expected based on the world average for similar publications, for example a score of 1.44 means that the outputs have been cited 44% more times than expected. • A Field-Weighted Citation Impact of less than 1.00 indicates that the publications have been cited less that would be expected based on the world average for similar publications, for example a score of 0.85 means 15% less cited than world average. • Similar publications are those publications in the Scopus database that have the same publication year, publication type and discipline. • Field-Weighted Citation Impact refers to citations received in the year of publication plus the following 3 years. • Field-Weighted Citation Impact metrics are useful to benchmark regardless of differences in size, disciplinary profile, age and publication type composition, and provide and useful way to evaluate the prestige of a researcher’s citation performance.
Source Normalized Impact per Paper (SNIP) IF در پاسخ به کاستیهای ضریب تاثیر مجلات 1- ناکافی بودن بازه زمانی دو ساله برای رشتههای ایستاتر که دیرتر به پختگی استنادی میرسند، 2- عدم تصحیح تفاوت رفتار استنادی در رشتهها و در نتیجه عدم قابلیت این شاخص برای مقایسهی مجلات رشتههای مختلف، 3- عدم تصحیح تفاوت پوشش پایگاهی رشتهها ، 4- سوگیری پایگاه های آی اس آی به نفع مجلات انگلیسی- امریکایی و 5- تفاوت در نوع منابع در صورت و مخرج کسر . در این میان، عدم امکان مقایسهی بین رشتهای از مهمترین اشکالات وارده به آن بوده است که سنیپ میکوشد تا آن را برطرف سازد.
Source Normalized Impact per Paper (SNIP) SNIP was created by Professor Henk Moed at the Centre for Science and Technology Studies (CTWS), University of Leiden. It measures contextual citation impact by weighting citations based on the total number of citations in a subject field, using Scopus data. Or, as stated by the CTWS, “SNIP corrects for differences in citation practices between scientific fields, thereby allowing for more accurate between-field comparisons of citation impact.”
Citation Databases • Web of Science • Scopus • Google Scholar
Other Tools Available • Other bibliometric indicators: • Journal Citation Reports (JCR) • Other indicators databases (national, essential, university, institutional) • ISIHighlyCited.com
WoS and Scopus: Subject Coverage (% of total records) WoS SCOPUS Google Scholar ?
Web of Science • Covers around 9,000 journal titles and 200 book series divided between SCI, SSCI and A&HCI. • Electronic back files available to 1900 for SCI and mid- 50s for SSCI and mid-70s for A&HCI. • Very good coverage of sciences; patchy on “softer” sciences, social sciences and arts and humanities. • US and English-language biased. • Full coverage of citations. • Name disambiguation tool. • Limited downloading options.
Scopus • Positioning itself as an alternative to ISI • More journals from smaller publishers and open access (+15,000 journals; 750 conf proceedings) • Source data back to 1960. • Excellent for physical and biological sciences; poor for social sciences; does not cover humanities or arts. • Better international coverage (60% of titles are non-US) • Back to 1996 ! (e.g. citation data for the last decade only) • Not “cover to cover” and not up to date • Easy to use in searching for source publications; clumsy in searching cited publications. • Citation tracker works up to 1000 records only. • Limited downloading options.
What is Scopus? • +15,200 titles from more than 4,000 publishers • +1,000+ Open Access journals • +500 Conference Proceedings • 400M web pages • 21M patents • Repositories • Digital Archives
Focused web information 15,100 titles STM & Social sciences World’sLargestAbstract & CitationDatabase Academic library sources 4,000 publishers What is Scopus? 240 million scholarly Web items, E-prints, theses, dissertations, 13 M patents 15% Elsevier sources 85% other publishers Fastest route to FullText
2,700 2,500 4,500 5,900 Scopus Coverage15,100 Unique titles Chemistry Physics Engineering Biological Agricultural Environmental Life & Health (100% Medline) Social Sciences Psychology Economics