Download
1 / 59
590 likes | 840 Views
Recovery of the Antarctic ozone hole P. Newman 1 , E. Nash 1 , S. R. Kawa 1 , S. Montzka 2 , Susan Schauffler 3 , R. Stolarski 1 , S. Pawson 1 , A. Douglass 1 , J. E. Nielsen 1 , S. Frith 1 University College Dublin, Sept. 21, 2006. Introduction Ozone Hole trends

E N D
Recovery of the Antarctic ozone holeP. Newman1, E. Nash1, S. R. Kawa1, S. Montzka2,Susan Schauffler3, R. Stolarski1, S. Pawson1, A. Douglass1, J. E. Nielsen1, S. Frith1University College Dublin, Sept. 21, 2006 Introduction Ozone Hole trends CCM model prediction of ozone hole Parametric model Controlling factors Model outline Predictions of Recovery Estimating recovery Uncertainties Climate Change and Recovery Summary 1NASA/GSFC, 2NOAA/ESRL, 3NCAR
Why is understanding ozone hole recovery important? • The ozone hole is the poster child of atmospheric ozone depletion • Scientists staked their reputations on ozone depletion - international regulations were implemented. We need to carry our predictions through. • Severe ozone holes lead to acute UV events in mid-latitudes • Possible regulation changes could accelerate the phase out of ozone depleting chemicals. • The ozone hole is a fundamental example of mankind’s ability to alter our atmosphere and climate - forming a useful example on climate change policy
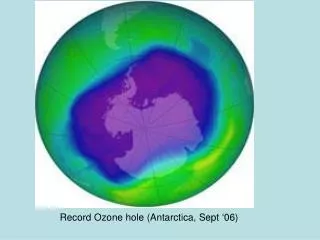
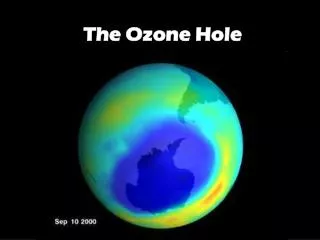
Extremely cold temperatures are found in the lower stratosphere in spring and fall South America Extremely low values Green-blue indicates low ozone values, while orange-red indicated high values Antarctica Strong jet stream (the polar vortex) acts to confine ozone losses over Antarctica High values are normally found in the mid-latitudes TOMS 1984 October 1984 TOMS total ozone
Halley Bay Station October Average Ozone Hole Low Ozone High Ozone
Defining the Hole • Ozone hole area is defined by the area coverage of ozone values less than 220 DU = 24.7 M km2 • 220 DU located near strong gradient • 220 DU is lower than values observed prior to 1979 • Values of 220 tend to appear in early September. TOMS doesn’t make measurements in polar night! • Values of 220 tend to disappear in late November • Ozone hole minimum is 94 DU Antarctic Ozone Hole on Oct. 4, 1998
Daily Ozone Hole Area 24.7 M km2 on Oct. 4, 1998 Derive average size from an average of daily values: Sep. 7-Oct. 13
Sept. 17, 2006 Ozone < 220 DU Aura OMI
Assessment of the ozone hole’s recovery (WMO, 2003) Chapter 3 - Polar Ozone
Model area estimates WMO Fig. 3-47
Model area estimates WMO Fig. 3-47
Model area estimates WMO Fig. 3-47
Minimum Ozone WMO Fig. 3-47
Model Predictions Summary • WMO assessment (2004): “These models suggest that the minimum column ozone may have already occurred or should occur within the next decade, and that recovery to 1980 levels may be expected in the 2045 to 2055 period.” • CCM losses tend to be too small • All of the CCMs underestimate the ozone hole area. • In general, the CCMs overestimate the depth of the ozone hole.
PSCs • PSC composition & phase are key to heterogeneous reaction rates • II - Crystaline water Ice ~ 188 K • Ia - Crystaline particles above frost point ~ 195 K • Ib - liquid particles above the frost point ~ 192 K • PSCs control de-nitrification and de-hydration, which influences ozone loss Photo: Paul A. Newman - Jan. 14, 2003 - Southern Scandanavia
HCl PSC ClONO2 Cl2 HNO3 Antarctic ozone hole theory Solomon et al. (1986), Wofsy and McElroy (1986), and Crutzen and Arnold (1986) suggest reactions on cloud particle surfaces as mechanism for activating Chlorine Cl2 is easily photolyzed by UV & blue/green light HNO3 is sequestered on PSC
1. O3 + Cl ClO + O2 3. ClOOCl+h2 Cl+O2 3 O2 2. 2 ClO + M ClOOCl + M Polar Ozone Destruction 2 O3 Only visible light (blue/green) needed for photolyzing ClOOCl No oxygen atoms required Net: 2O3 + h 3O2
Chlorine and Bromine NOZE 1 & 2 missions in 1986: High-concentrations of chlorine monoxide at low altitudes in the Antarctic spring stratosphere - diurnal-variations, R. Dezafra, M. Jaramillo, A. Parrish, P. Solomon, B. Connor, J. Barrett, Nature, 1987 AAOE mission in August-September 1987: observations inside the polar vortex show high ClO is related to a strong decrease of ozone over the course of the Antarctic spring: J. Anderson et al., JGR, 1989 Ozone (ppmv) Latitude (˚S)
Ozone Hole Area Versus Year Polar vortex ≈ 33 Million km2
Ozone Hole Residual Area Vs. T If the temperature is 1 K below normal, then ozone hole’s area will be 1.1 Million km2 larger than normal. See Newman and Nash, GRL, 2004 O3 residual area: 9/21-9/30 T: 9/11 - 9/20, 50 hPa, 55-75ºS
Problem • We have reasonably good estimates of temperatures over Antarctica from radiosondes and satellite temperature retrievals • We only have snapshots of Cl and Br over Antarctica • How can we estimate Cl and Br over Antarctica for all of our observed ozone holes?
Ozone Loss Source Chemicals • Surface concentrations ~ 1998 • Cl is much more abundant than Br • Br is about 50 times more effective at O3 destruction From Ozone FAQ - see http://www.unep.org/ozone/faq.shtml
Production fully banned in US by Pres. Bush Atmospheric Chlorine Trends from NOAA/ERL - Climate Monitoring Division 102 years CFC-12 CFC-11 Steady growth of CFCs up to 1992 50 years CH3CCl3 CCl4 42 years 85 years CFC-113 5 years Updated Figure made by Dr. James Elkins from Trends of the Commonly Used Halons Below Published by Butler et al. [1998], All CFC-113 from Steve Montzka (flasks by GC/MS), and recent updates of all other gases from Geoff Dutton (in situ GC).
CFC-12 (CCl2F2) pathway to Antarctica 0.01 80 Cl catalytically destroys O3 0.1 64 CFC-12 photolyzed in stratosphere by solar UV, releasing Cl Cl reacts with CH4 or NO2 to form HCl or ClONO2 1 48 Altitude (km) Pressure (hPa) Carried into stratosphere in the tropics by slow rising circulation 10 32 HCl and ClONO2 react on the surfaces of PSCs 100 16 CFC-12 released in troposphere 1000 0 -90 -60 -30 0 30 60 90 Latitude
CCM mean age-of-air (Sept.) GSFC GEOS-4 mean age-of-air derived from advected age tracer. Magenta line is the tropopause, white lines are zonal mean zonal wind Grey lines schematically show mean flow.
CCM mean age-of-air (Sept.) Air at a particular point in the stratosphere is a mixture of air parcels that have come together from a multitude of pathways with different times of transit. This “spectrum” of transit time forms an “age-spectrum” that has a mean value and a spectrum “width”
Age Spectra The spectrum is convolved with the surface observation time series to yield the stratospheric time series.
4-year 3-year CFC-11 Inorganic CFC-11 Inorganic 5-year 2-year CFC-11 Inorganic CFC-11 Inorganic 1-year CFC-11 Inorganic 0-year CFC-11 Inorganic CCM mean age-of-air (Sept.)
5-year CFC-11 Inorganic 0-year CFC-11 Inorganic CCM mean age-of-air (Sept.) If we know the mean age of air (), and we know the fractional release rate as a function of , then we can estimate the chlorine available from CFC-11 for ozone loss
CFC-11 break down Schauffler et al. (2003)
Estimating halogen (Cl & Br) levels over Antarctica • Observations show that it takes about 5.5 years for air to get to the Antarctic stratosphere - tropospheric CFCs in January 2000 yield Antarctic stratospheric Cl in July 2005! • We use observed CFCs & mean age-of-air estimates to calculate fractional release rates as a fcn. of age • EESC = equivalent effective stratospheric chlorine n= # Cl or Br atoms,f= release rate, = chemical mixing ratio, = scaling factor to account for Br efficiency for ozone loss
EESC Observed total chlorine* (surface) Estimated stratospheric chlorine
Parametric model of the ozone holeMethodfit ozone hole size to quadratic functions of EESC and temperature
Ozone Hole Parametric Model Area is a function of Effective Equivalent Stratospheric chlorine (EESC) and temperature EESC = 0.8 G(CCly) + G(CBry) G = Age Spectrum (6 year mean age, 3 year width) CCly and CBry from WMO (2003) EESCmax = 3.642 ppbv a0 = -69.5 million km2 a1 = 50.9 million km2/ppbv a2 = -1.08 million km2/K A = 0 for EESC = 1.817 ppbv = residual area r = 0.971 (r2=.943)
Ozone Hole Area vs. Year (2) Temperature effect is removed
Ozone Hole Area vs. Year (3) (92) Black line represents the fit of area to EESC Area residual = 1.8 M km2 Unexplained residual for 1992 ~ 3 m km2
Ozone Hole Area vs. Year (4) Using WMO (2003) Cly and Bry projections, we use our fit to project the ozone hole area