Download
1 / 22
230 likes | 464 Views
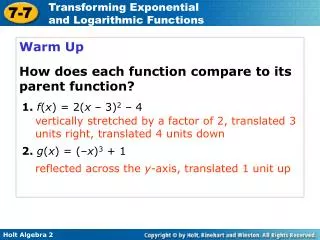
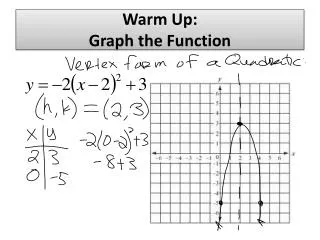
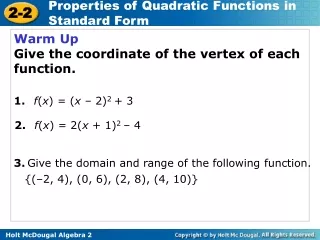
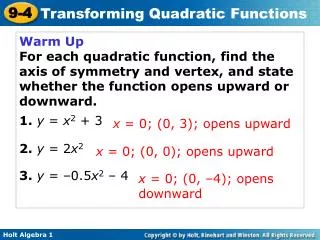
Warm Up For each quadratic function, find the axis of symmetry and vertex, and state whether the function opens upward or downward. 1. y = x 2 + 3 2. y = 2 x 2 3. y = –0.5 x 2 – 4 . x = 0; (0, 3); opens upward . x = 0; (0, 0); opens upward. x = 0; (0, –4); opens downward.

E N D
Warm Up For each quadratic function, find the axis of symmetry and vertex, and state whether the function opens upward or downward. 1. y = x2 + 3 2. y = 2x2 3. y = –0.5x2 – 4 x = 0; (0, 3); opens upward x = 0; (0, 0); opens upward x = 0; (0, –4); opens downward
Objective Graph and transform quadratic functions.
Remember! You saw in Lesson 5-9 that the graphs of all linear functions are transformations of the linear parent function y = x.
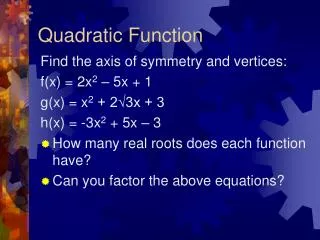
The axis of symmetry is x = 0, or the y-axis. • The vertex is (0, 0) • The function has only one zero, 0. The quadratic parent function is f(x) = x2. The graph of all other quadratic functions are transformations of the graph of f(x) = x2. For the parent function f(x) = x2:
The value of a in a quadratic function determines not only the direction a parabola opens, but also the width of the parabola.
f(x) = 3x2 g(x) = 0.5x2 Order the functions from narrowest graph to widest. f(x) = 3x2, g(x) = 0.5x2 Find |A| for each function. The function with the narrowest graph has the greatest |A|. |3| = 3 |0.05| = 0.05
g(x) = x2 Order the functions from narrowest graph to widest. f(x) = x2, g(x) = x2,h(x) = –2x2 |1| = 1 |–2| = 2 h(x) = –2x2 The function with the narrowest graph has the greatest |A|. f(x) = x2
f(x) = –x2, g(x) = x2 g(x) = x2 Order the functions from narrowest graph to widest. The function with the narrowest graph has the greatest |A|. |–1| = 1 f(x) = –x2
The value of c makes these graphs look different. The value of c in a quadratic function determines not only the value of the y-intercept but also a vertical translation of the graph of f(x) = ax2 up or down the y-axis.
Helpful Hint When comparing graphs, it is helpful to draw them on the same coordinate plane.
g(x) = x2 + 3 • The graph of g(x) = x2 + 3 is wider than the graph of f(x) = x2. • The graph of g(x) = x2 + 3 opens downward. Compare the graph of the function with the graph of f(x) = x2.
Compare the graph of the function with the graph of f(x) = x2 g(x) = 3x2
Compare the graph of each the graph of f(x) = x2. g(x) = –x2 – 4
Compare the graph of the function with the graph of f(x) = x2. g(x) = 3x2 + 9
Compare the graph of the function with the graph of f(x) = x2. g(x) = x2 + 2
The quadratic function h(t) = –16t2 + c can be used to approximate the height h in feet above the ground of a falling object t seconds after it is dropped from a height of c feet. This model is used only to approximate the height of falling objects because it does not account for air resistance, wind, and other real-world factors.
Two identical softballs are dropped. The first is dropped from a height of 400 feet and the second is dropped from a height of 324 feet. a. Write the two height functions and compare their graphs. h1(t) = –16t2 + 400 Dropped from 400 feet. h2(t) = –16t2 + 324 Dropped from 324 feet.
The graph of h2 is a vertical translation of the graph of h1. Since the softball in h1 is dropped from 76 feet higher than the one in h2, the y-intercept of h1 is 76 units higher. b. Use the graphs to tell when each softball reaches the ground.
Caution! Remember that the graphs show here represent the height of the objects over time, not the paths of the objects.