Download
1 / 14
140 likes | 241 Views
Study inversion breakup, provide in situ data for algorithm development, proof of concept using Freescale pressure transducer and more. Uncover interesting spikes and data insights.

E N D
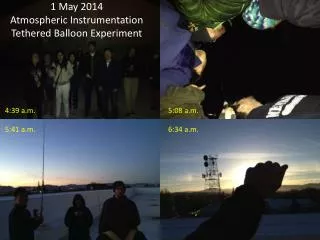
1 May 2014Atmospheric Instrumentation Tethered Balloon Experiment 4:39 a.m. 5:08 a.m. 5:41 a.m. 6:34 a.m.
Freescale pressure transducer Atmospheric Sounding Package Chronodot real time clock Four 36” diameter He filled balloons lofted this packageto about 100 meters aboveground level. Purpose: Study inversion breakup. Provide in situ data for FTIR retrieval algorithmdevelopment. Proof of concept. The boards were assembledby students after bread boarding up the design. CO2 and pressure werefrom analog inputs. All othersensors were digital. CO2 is uncalibrated in this data set,but relatively relevant. SHT75 temperature and RH micro SD card Teensy 3.1 microcontroller Telaire 6004 CO2
Narayan’s Detailed FTIR Spectra: Inversion develops much from 4:30 to 6:00 am
Ultrasonic Anemometer Vertical Velocity: Interesting Spikes near 7:15 and 7:45 a.m. Interesting!!
Last Flight Balloon Data: Rapid ascent, long loiter, slow descent to the surface dry layer aloft and inversion
Last Flight Balloon Data: Rapid ascent, long loiter, slow descent to the surface. CO2 data. WOW! What’s going on?
The Solar Semi-diurnal pressure wave produces a minimum pressure and a maximum pressure twice a day; minimums occur about three hours before sunrise and a few hours before sunset; maximums occur a few hours after sunrise and a few hours after sunset. As the Sun heats the atmosphere, (particularly the upper parts of the atmosphere, where ozone and water vapor are very effective at absorbing energy), and the Earth rotates, the mass of air is redistributed on the Earth. The heated, expanded atmosphere literally pushes air ahead of the rising Sun in a bi-modal wave, causing peaks and valleys of pressure, and resulting in a slightly decreased pressure a few hours before sunrise; the decrease in pressure can translate to a slightly decreased air temperature. http://www.newton.dep.anl.gov/askasci/wea00/wea00042.htm