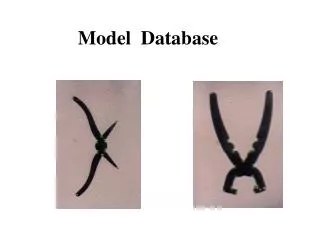
Model Performance Evaluation Database and Software
Model Performance Evaluation Database and Software. Betty K. Pun, Kristen Lohman, Shu-Yun Chen, and Christian Seigneur AER, San Ramon, CA Presentation at the RPO Workgroup Meeting St. Louis, MO 5 November 2003. Acknowledgement.


Model Performance Evaluation Database and Software
E N D
Presentation Transcript
Model Performance Evaluation Database and Software Betty K. Pun, Kristen Lohman, Shu-Yun Chen, and Christian Seigneur AER, San Ramon, CA Presentation at the RPO Workgroup Meeting St. Louis, MO 5 November 2003
Acknowledgement • Funding for this work is provided by CENRAP under Modeling Umbrella Contract 02-00307-RP-005 Work Order 1 • Calvin Ku, Missouri DNR and Matthew Johnson, Iowa DNR for their continuous support • CENRAP Modeling Workgroup and outside reviewers for feedback on work plan and suggestion on useful features in the MPE database and software
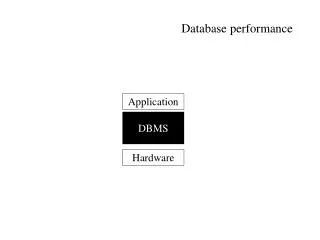
The Role of Model Performance Evaluation Model Application Model Evaluation Regulatory Application Model/Data Improvement The modeling cycle iterates until performance is good enough for use in strategy design; hence the need to streamline and automate model performance evaluation
Model Performance Evaluation in a Nutshell Ambient Data Model Results Model Evaluation Software + Graphics Package Performance Statistics Paired peak error Unpaired peak error Gross error Gross bias Normalized bias Normalized error Root mean square error Coefficient of determination ... Graphics Time series Scatter plots Pie charts ...
Data Available for PM Model Performance Evaluation Routine Monitors • IMPROVE: 24 hour PM2.5 and component data, one in three days • CASTNet: 7-day sulfate, nitrate, ammonium, SO2, and HNO3 (may be problematic) • AQS: hourly to daily PM10, PM2.5, PM2.5 speciation, O3, NO, NO2, NOy, VOC, SO2 Special Studies • PM Supersites • BRAVO • Others
What we have: Many data sources Different formats Supporting information sometimes separate from data and sometimes difficult to find What we need: Preferably one data source Consistent format Supporting information site location sample start time including time zone sample duration units How to Consolidate, Store, and Retrieve Ambient Data for MPE? • MySQL database • upload data • (measurement, site) • compile other • relevant information • use query to • retrieve data in • consistent format
Database Design Principles • Storage requirements: use a hierarchical design • Network (e.g., averaging period, frequency) • Site (e.g., location) • Parameter (e.g., units) • Measurement • Ease of data updates • Each network stored in separate tables; each table can be updated independently • Use original data format to the extent possible • Scripts used for adding supplementary information and data screening
Querying the MPE Database for Monitoring Sites • Site query SELECT site, “IMPROVE”, latitude, longitude INTO OUTFILE ‘improve.site.dat’ FIELDS TERMINATED BY ‘,’ FROM IMPROVE_LOCS ORDER BY site; • Sample result BIBE1,IMPROVE,29.3207,-103.178
Querying the MPE Database for Measurement Data • Data query SELECT m.site_code, year(m.obs_date), month(m.obs_date), dayofmonth(m.obs_date), hour (n.starttime), s.timezone, n.avgtime_hr, (m.sf_val * 3), concat(‘’\’’”, p.units, “\””) INTO OUTFILE ‘improve.dat’ FIELDS TERMINATED BY ‘,’ FROM NETWORK_INFO as n, IMPROVE_LOCS as s, IMPROVE_VAR as p, IMPROVE_DAT as m WHERE m.sitecode = s.site AND n.network_id = “IMPROVE” and p.varname = “Sf_val” AND year(m.obs_date) = 2002 ORDER BY m.site_code, m.obs_date; • This query utilizes all 4 levels in the hierarchy of information organization • Sample result: BIBE1,2002,10,5,0,CT,24,3.619,”ug/m3”
Processing Model Results • Two common formats of output files: binary and NetCDF • Platform-independent NetCDF format selected as standard • CMAQ files requires no conversion • Fortran binary to NetCDF converters developed • CAMx concentration data • CAMx deposition data • PM-CAMx concentration data • MM5CAMx meteorology data
MPE Software Database Model or Preprocessor Formatted ambient data NetCDF data Model Performance Evaluation Software Model/measurement cross reference tables Processing Component User input (control file): - model - species options - subdomain options - temporal processing options - spatial processing options - statistics options ... Statistics Component Data output Graphics Package Graphics Statistics
Processing Component • Read observations • perform time zone changes • average to longer periods • perform unit conversions • Extract modeling data • calculate grid cell corresponding to latitude/longitude • extract model data at grid cell(s) • sum components of species • average to longer periods • perform unit conversions
Cross Reference TablesCAMx4.0, PMCAMx, CMAQ • Used to look up what model species to extract based on model name and species evaluated • Selected entries
Species Options • PM2.5 and PM10 mass • PM2.5 components: sulfate, nitrate, ammonium, organic material, black carbon • PM fraction • MPE software extracts relevant PM mass and species concentration to calculate PM fraction • MySQL query to calculate PM fraction at sites with co-located PM2.5 and speciated PM measurements • Gases: O3, VOC (ppbC and ppb options), NOx, NOy, SO2 • Wet deposition • Option to evaluate concentration in precipitation or deposition flux
All sites included in monitoring site and data files User to provide a list in a file (e.g., a metropolitan statistical area) User to specify minimum and maximum latitude and longitude User to specify minimum and maximum cell numbers in the x and y direction An RPO performance evaluation zone (J. Underhill/D. Watson, 2003) Subdomain Options
Temporal Processing Options • User can select sub-period within simulation period for evaluation • User can specify a comparison interval that is greater than or equal to the measurement interval • MPE software will temporally average both measurements and model results based on the comparison interval • A completeness criterion is needed when performing temporal averaging (>75% recommended)
Spatial Processing Options • Extract model value at grid cell corresponding to site location • Linear interpolation using 4 closest grid cell • Average of all cells within a user specified window • Best estimate with a user specified window • Distance-weighing method within a user specified window
Statistical Options • Threshold to be selected by user • Default output metrics • accuracy of peak (unpaired in time): paired and unpaired in space • mean observed and modeled value • Gross and normalized bias and error • Coefficient of correlation • Normalized root mean square error • Optional output metrics • ratio of means, fractional bias and error, r2, index of agreement, site specific root mean square error, normalized mean bias and error
Graphics package e.g., excel Outputs .stat header (model, period, species, units data files, options) mean observed value 39.3 mean modeled value 31.6 normalized bias -16.7% ... .tser Site, year, month, day, time, obs, sim CHE185,1998,7,2,20,32.2,39.9 CHE185,1998,7,3,20,40.8,38.1 … BBE401,1998,7,2,20,42.0,24.7 BBE401,1998,7,3,20,41.7,23.7 …
An MPE Database and Software Designed for Community Use • Comprehensive Processor • data base; binary to NetCDF converter; software • output compatible with common graphics software • Versatility • PM, PM components, gases, deposition fluxes • User-friendly Design • CENRAP review and community input for software features • Software engineering standard • Based on Fortran 90 and MySQL (free!) • Documentation