Download
1 / 24
240 likes | 346 Views
Assessment in Advising: Getting the Right Stuff 2013 Academic Advising Conference Adrian Hall. Introduction Have you ever asked: How many students are we serving? Is it making a difference? Can we use data to tell a compelling story?. Outline

E N D
Assessment in Advising: Getting the Right Stuff 2013 Academic Advising Conference Adrian Hall
Introduction Have you ever asked: • How many students are we serving? • Is it making a difference? • Can we use data to tell a compelling story?
Outline Strategies for using data in assessment of advising or other student supports 1. Do we need to? 2. What has already been done? 3. What data can we access? 4. What do we need exactly? 5. What else should we do when we’re done?
1. Do we need to? • Think ahead and ask “What are we going to do with this when we’re done?” • Who is our audience? • Internal (within your office) • Local (around your institution) • External (outside of your institution) • What other potential value can we find?
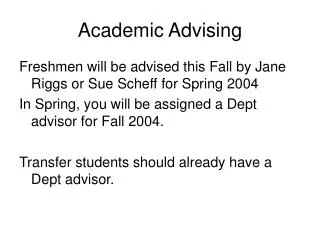
Do we need to? Example: We currently offer freshmen two different formats for their first year advising. Which is better? Let’s do assessment to find out!
1. Do we need to? Example (continued) • Will we choose between these two formats? • Can we commit to changing our practice based on results? • Is this just to help us decide, or will we share the results with others? • Can we share with other offices here at the university? • Can we get some talking points to use on our public website? • Could we do the same assessment of transfer students? • Are we doing this assessment one time for this year, or should we do it again next year?
Plan to create something with multiple uses, serving multiple audiences. Set out to obtain talking points that you will be able to deliver multiple times.
2. What has already been done? • Has anyone assessed our students before? • Do we have a basis for comparison? • Has someone established a method that will work for us? • What should we really be looking at?
2. What has already been done? • Reports Published by the Office of Institutional Research • Fall to fall retention: http://www.uc.edu/content/dam/uc/provost/docs/institutional_research/student_reports/retention_rates/UC-Fall-to-Fall-Retention-Cohort.pdf • Graduation rates: http://www.uc.edu/content/dam/uc/provost/docs/institutional_research/student_reports/graduation_rates/uc_grad_rates_2012-2013_uptown_2006_cohort.pdf • Student Satisfaction Inventory Results (SSI):http://www.uc.edu/provost/offices/institutional_research/research-and-assessment.html • National Survey of Student Engagement Results (NSSE): http://www.uc.edu/content/dam/uc/provost/docs/institutional_research/research_assessment/nsse/nsse_uc_means_comparison_reports/uc_means_comparison_yearly/NSSE11_Means_Comparison_Yearly_Report-%28UC%29.pdf
2. What has already been done? Example: Which of our two first-year advising formats is better?
2. What has already been done? Example (continued) • Should we compare fall to fall retention rates to the university average? • Should we compare graduation rates? • Should we ask certain questions related to student satisfaction or engagement?
2. What has already been done? • Build onto a foundation. • Create results that can integrate and complement existing reports. • Avoid recreating reports! • Present summary findings to external audiences very carefully, avoiding duplication or contradiction with other reports, and respecting personal data.
3. What data can we access? • Do we know which students we’re talking about? • Are there characteristics already in our information system? Have they been used correctly? • Has any data been entered manually?
3. What data can we access? Example: Which of our two first-year advising formats is better?
3. What data can we access? • All freshman student IDs. • All freshman GPA’s, hrs completed (if a semester has passed). • Fall to fall enrollment (if a year has passed). • Freshmen who participated in one or the other format? • Advising notes? • Survey of our students? • Do we need to create more data?
3. What data can we access? • Utilize previous work, and existing practices. Avoid redundancy. • Carefully survey students (avoid survey burnout!) • Consider relevant work and data to the greatest extent possible.
4. What do we need exactly? • Can you access and extract the particular data you need? • Who is your resource for submitting a data request? • How should you approach them? • How much lead time can we give?
4. What do we need exactly? Example: Which of our two first-year advising formats is better? We want to see fall to fall retention data for last year’s freshmen to see if those in one format was higher.
4. What do we need exactly? When requesting data: • Give credit to those who contribute and communicate with their supervisor. • Engage in a dialogue to explain the overall goals and added values. • Provide the Student ID’s, or the exact characteristic identifying the students who received each of the advising formats. • Consider if you need to identify students with freshman class rank, or specifically first-year admits, etc. • Consider other important characteristics which impact your study (i.e. ACT score). • Avoid “gray” characteristics (i.e. attitude, mindset, economic status). • Provide as much lead time as possible.
Did we need to? • What had already been done? • What data did we access? • What did we do exactly? 5. What else should we do when we’re done?
5. What else should we do when we’re done? • What did we learn? What should we change as a result? • Who else will be interested? • How should we present it? • Are we confident enough with our results that we can identify a talking point to use with external audiences? • Will we need to do this again? Wait, how did we just do that??
5. What else should we do when we’re done? Example: Which of our two first-year advising formats is better? We examined fall to fall retention data for last year’s freshmen, and found that those in one format was higher even though both groups of students were similar otherwise. Fall to fall retention for those in this format was a little higher than the university average.
5. What else should we do when we’re done? • Can we scrap the other format, or change it? • Do we need to adopt a new data collection practice? • Do other colleges/programs use similar advising formats? • Are we confident enough with our results that we can use a talking point when talking with external audiences?
Conclusions When employing data in assessment of our student support: Build on existing work. Avoid duplication/redundancy. Create new work that has the maximum value. Avoid duplication/redundancy. Share your work with others so that they can benefit too.