Macromolecular Structure Database Structural Database Infrastructure Services for Europe
Macromolecular Structure Database Structural Database Infrastructure Services for Europe. www.ebi.ac.uk/msd. The MSD databases. The MSD actually consists of two separate databases:

Macromolecular Structure Database Structural Database Infrastructure Services for Europe
E N D
Presentation Transcript
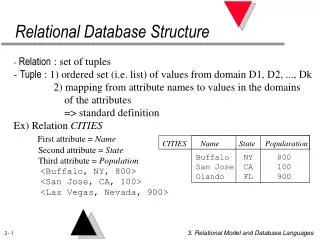
Macromolecular Structure Database Structural Database Infrastructure Services for Europe www.ebi.ac.uk/msd
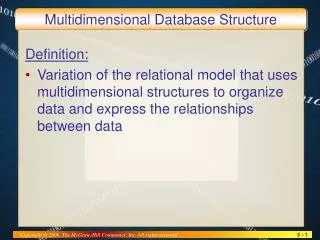
The MSD databases The MSD actually consists of two separate databases: • the archive database is highly normalized, with thousands of relationships linking some 400 tables; the deposition database is the definitive archive for all structural data at MSD • the search database is a much simpler, denormalized database, with data items duplicated and aggregated into 40 much wider tables, making it more amenable to searching and retrieval of data : the MSDSD
What is the MSDSD database • A relational database primarily developed in Oracle that stores the data derived from the PDB together with reference and other derived information • Simple to understand for the novice biologist and fast in performance for the database non-expert • Originates from the internal MSD archive database that ensures accuracy and data integrity • In MSDSD naming and other summary information is repeated from every level of the hierarchy to the next one in order to be closer to the familiar PDB data
Main MSDSD features • The symmetry has been expanded and the information of the quaternary biological assemblies is directly available • External Information like binding sites and secondary structure has been derived on the assembly level • The original PDB asymmetric unit is also available • Includes and provides clear database relations with the ligands “data mart” and other reference information • Includes information and cross-references to external databases (NCBI taxonomy, UniProt, SCOP etc)
DATA Analysis Data mining is a term that is applied very loosely within bioinformatics to describe any type of data analysis. Almost without exception the analysis of molecular biology is hypothesis based where the search for information has a target that is defined by the knowledge of the biological context of the data.
Data Mining • “Analysis of data in a database using tools which look for trends or anomalies without knowledge of the meaning of the data.” • “True data mining software does not just change the presentation, but discovers previously unknown relationships among the data. • (Webopedia and other technical dictionaries)” was first “invented” by IBM
Traditional analysis is via “verification-driven analysis” • Requires hypothesis of the desired information (target) • Requires correct interpretation of proposed query • Discovery-driven data mining • Finds data with common characteristics • Results are ideal solutions to discovery • Finds results without previous hypothesis
So what is Hypothesis driven data analysis ? • Define a target = hypothesis • Search for target • There are/are-not “hits” • Verify/negate hypothesis • Distribution is centred on target “catalytic triad” : text string matching Atomic coordinates : coordinate superposition Mathematical graph : graph matching HIS,ASP,SER : data hierarchy knowledge
For example, it is possible to find the presence of catalytic triads within the PDB by selecting an example structure and then using a matching technique such as coordinate superposition or graph analysis to screen this against all the coordinate data within the PDB. This will identify the presence of similar residue configurations to the search target and result in a distribution of hits centered on the original search model. HOWEVER we can only find similar objects distributed about this target.
Discovery-driven data mining • Finds data with common characteristics • Results are ideal solutions to discovery • Finds results without previous hypothesis • Target is mathematical – so has no scientific dependency
Mining techniques • Creation of predictive models : future data expectation • Link analysis : connections between data objects • Database segmentation : classification • Deviation detection : finding outliers.
So what is this data mining ? • Given multiple sets of primary data) • Characters, numbers, Function(numbers),…. • Find anomalies • To many : numerical occurrence • Data variation : Derivatives • Singularities • Correlations and clusters • Within primary data • with other data (dependent variables) Finds new things ! But not what it means !
Discovery driven data mining of the PDB • Analysis of 3-dimensional coordinates • Defined common patterns of atomic interactions locally • DB segmentation - active sites & common packing features • Link analysis - Similarity between different functional group • Defined globally • DB segmentation - common patterns of super-secondary str’ • Link analysis - common folds in diverse protein families • Outlier detection - unique folds • Nucleic Acid sequences • Define information content using information technology
Issues • Systematic “error” propagates as solution • 300 lysozyme structures return as a strong solution • Results cannot be found below the noise level • Need to characterise the noise level • Need to improve signal/noise ratio (S/N) to see information • Target is not biologically defined • It does not give you the biological answer • Results should reproduce known biology • Can give you new results not previously observed
Data selection • Cannot leave in 300 lysozyme structures ! • Select by sequence similarity at 70% exact alignment • Different “phase space” to select data • Remove structures with resolution < 2.5A • Remove NMR (different statistics) • Remove pre-1982 etc. • Geometrical analysis criteria to check for outliers
Off the shelf products • Main problem – they “all” do column correlation – but this requires row analysis • Ie you can find whether x coordinates are more correlated to y coordinates than z coordinates • Slow • I tried the above on 1e3 of data and it took hours; not much chance on 1.6e9 data then. • Money often
Local atomic interactions • Data • 3D coordinates • Atom types • Residue types • Convert coordinates to distances - easier to compare, no need to superpose coordinates. • Create 3D Hash table of triplets of distances between “points”
Local atomic interactions • Merge triplets • Any pair of N-fold interactions are a (N+1) interaction if they have (N-1) equivalence. • Just keep going until no more (N+1) interaction are found. • Time = 8 seconds • (Digital alpha ES40)
Local atom interactions • Define key atoms/groups-of-atoms as run time parameters. • Solves problem of residue symmetry • Approximation for speed • This is a hypothesis • External definition of residue equivalence (PHE TYR) for released data. • Improves Signal/Noise ratio. • This is a hypothesis
Is this data mining ? • Basic 3D correlation of distances is • Program can be run without any prior definitions. • Addition of key atoms and residue equivalence introduces biology and chemistry • introduces hypothesis regarding what is important. • Without adding this information you get very little out. • Improvement to the method should spot this without being told !
Re-implemented • This idea has been re-implemented • Core analysis on distance only • Statistical analysis of residue equivalence is carried out – will find residue equivalence • Bit slower now – 2 minutes • To use MSD assembly data • Must be able to normalise by chain similarity to remove common features due to structure. • Can use MSD similarity tables for this.
Refining the answers • This analysis produces approximate geometrical results • For each “solution”, a second full All vs. All LSQ overlay is performed • handles symmetry in D,E,R,P,T • handles different residue overlays • Clusters results using average linkage • Writes average + superposed coordinates + ligands.
Electrostatic interaction Ligands are found close by rather than associated with the residues
N-linked glycosolation binding site +? • Spot the non-sugar • This glycosolation site is the same as active site found in “1a53” – indol-3-glycerolphosphate synthase
Summary • Creates 1000’s of results • Returns many metal and catalytic sites • 50% have at least 2 of 3 residues as sequence neighbours • 30% have associated ligands http://www.ebi.ac.uk/msd-srv/MSDtemplate/ See T.J.Oldfield (2003) PROTEINS: Structure, Function, and Genetics 49, 510-528. T.J.Oldfield (2002) Acta Cryst. D57, 1421-1427
Data mining – not idiot proof • Date of birth and age will give 100 % correlation • Authors for structure submission will be correlated to authors on primary citation. • “Lysozyme” is the most common fold pattern • 36 spelling’s of E.Coli will mask results. • Requires representative sets • Statistically valid ones too ! • Signal/Noise ratio is a problem : hit the noise and the calculation grows rapidly
Other methods • Representative sets and clustering • Another talk • Data mining fold • Information technological analysis of genomes