Download
1 / 29
290 likes | 403 Views
The September 6, 2011 report by Marsha A. Brown, Director of Student Services, presents data on California high school assessments including CST, CAHSEE, and AYP. It compares Spring 2011 results with a five-year trend, assessing both academic performance indices (API) and Adequate Yearly Progress (AYP). The report highlights progress and challenges within Albany Unified School District, with a focus on subgroup performance in English Language Arts and Mathematics. Overall, it discusses the district’s continued high performance while addressing areas needing improvement.

E N D
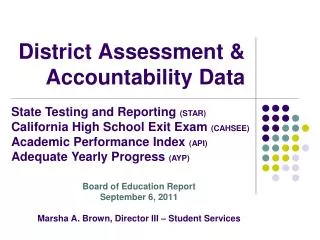
District Assessment & Accountability Data State Testing and Reporting (STAR)California High School Exit Exam (CAHSEE)Academic Performance Index (API)Adequate Yearly Progress (AYP) Board of Education Report September 6, 2011 Marsha A. Brown, Director III – Student Services
Agenda • California Standards Tests (CST) Results • Spring 2011 • 5-year comparison • California High School Exit Exam (CAHSEE) Results • 10th Grade 2011 results compared to State results • 3-year comparison • State Accountability: Academic Performance Index (API) • 5-year trend data & growth • School performance • Federal Accountability: Adequate Yearly Progress (AYP) • AYP Targets • District Performance
STAR 2011 Group Performance – California Standards Test (CST)
STAR Multi-Year Performance Level Distribution Mathematics English/Language Arts
STAR Multi-Year Performance Level Distribution Biology Science
STAR Multi-Year Performance Level Distribution History World History
State Accountability: Academic Performance Index (API) GOAL: All schools and districts will achieve the statewide performance target of 800 or above.
State Accountability:Academic Performance Index (API) • What is the API? • Growth (CST, CMA, CAPA) model • Far Below Basic 200 • Below Basic 500 (+300) • Basic 700 (+200) • Proficient 875 (+175) • Advanced 1000 (+125) • CAHSEE • No Pass 200 • Pass 1000 (+800) • What does the API Indicate?
Academic Performance Index 5 Year Growth – Significant Sub-Groups
Federal Accountability: Adequate Yearly Progress (AYP) GOAL: 100% of all students tested will be proficient in English-Language Arts and Mathematics by 2014.
Adequate Yearly Progress • There is ONE way to make AYP. • District/school and all sub-groups meet all targets • There are up to 46 different ways for a school or district to miss AYP. • Participation Rate • Up to 11 sub-groups in ELA and up to 11 sub-groups in Math for a total of 22 ways • Percent Proficient • Up to 11 sub-groups in ELA and up to 11 sub-groups in Math for a total of 22 ways • API - Additional indicator for AYP • Graduation Rate at the high school level
Federal Accountability: AYP • What is AYP? • Status Model • Students must reach proficiency • How is AYP determined? • Elementary & Middle School: STAR in ELA and Math • High School: CAHSEE • 380 Scaled Score instead of 350 • API: Minimum of 680 • Graduation Rate: One year delayed
English Language Arts 56.8% 67.6%
Adequate Yearly Progress • District met participation rates • Percent proficient – did not meet AYP targets in the following subgroups: • API – Met • Graduation Rate – Met (target: 86.4%) • 2009-10 89.66% • ENGLISH LANGUAGE ARTS • African American • Socio Economically Disadvantaged • MATHEMATICS • African American • Hispanic
Adequate Yearly Progress (AYP) Summary • Albany Unified School District met 30 of 34 AYP criteria • Did not make AYP for 2 years in a row (but different subgroups) • Two schools (out of five) made AYP • Cornell Elementary • Marin Elementary
SummaryCST • AUSD continues to be a high-performing district with high-performing schools and students • However, over 20% of our students score at Basic or below in ELA and Math • That percentage rises in Science and History/Social Science
Summary, continuedCAHSEE • AUSD exceeds the State in CAHSEE passage rates in both ELA and Math • Performance fell slightly for all subgroups in ELA in2011 • Performance held or increased slightly for all subgroups in Math (except English Learners)
Summary, continuedAPI • AUSD has shown steady growth for the past three consecutive years, which tapered off slightly for 2011 • Many subgroups lost ground in 2011 • A few subgroups grew (ELs and Spec Ed) • API went up for 4 out of 6 schools
Summary, continuedAYP • AUSD has made small, steady progress in % proficient or above overall • Subgroups are showing some gains, some losses (no apparent pattern) • Two subgroups met AYP through Safe Harbor • Spec Ed in ELA and Mathematics • SED in Mathematics • One school (AMS) has entered Program Improvement, Year 1