Download
1 / 12
120 likes | 281 Views
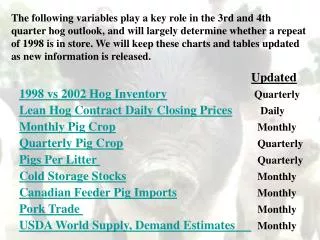
The following variables play a key role in the 3rd and 4th quarter hog outlook, and will largely determine whether a repeat of 1998 is in store. We will keep these charts and tables updated as new information is released. Updated 1998 vs 2002 Hog Inventory Quarterly

E N D
The following variables play a key role in the 3rd and 4th quarter hog outlook, and will largely determine whether a repeat of 1998 is in store. We will keep these charts and tables updated as new information is released. Updated 1998 vs 2002 Hog InventoryQuarterly Lean Hog Contract Daily Closing PricesDaily Monthly Pig CropMonthly Quarterly Pig CropQuarterly Pigs Per Litter Quarterly Cold Storage StocksMonthly Canadian Feeder Pig ImportsMonthly Pork Trade Monthly USDA World Supply, Demand Estimates Monthly
Monthly Pig Crop June and July monthly pig crop estimates were revised downward in the September quarterly report. Monthly pig crop estimates during the June-August period are now 1.0% to 2.6% lower than last year. The next monthly Hogs and Pigs Reports is scheduled for release on October 25 and can be accessed at: http://usda.mannlib.cornell.edu/reports/nassr/livestock/php-bb/2002/
Quarterly Pig Crop This chart shows the quarterly pig crop in 1998, 2001, and 2002. The March-May 2002 pig crop was up 1.3% from last year. This chart shows that the crop of pigs that will come to market in the 4th quarter (March-May pig crop) will likely be smaller than the corresponding crop in 1998. However, Canada is exporting substantially more feeder pigs to the US than in 1998. Consequently, a smaller US pig crop could potentially hit the capacity constraint. (See following page)
4th Quarter Slaughter: Actual 1998 vs Projected 2002 This chart compares actual 4th quarter 1998 weekly slaughter to projected 2002 weekly slaughter. The 2002 estimates are based on an estimated the market hog inventory by weight class and 2001weekly slaughter. Most of the weeks estimated slaughter is below 1998 levels and does not exceed the 2.2 million head level, suggesting the industry may survive the 4th quarter without breeching packer capacity.
Pigs Per Litter by Quarter 1997 1998 1999 2000 2001 2002 Mean Dec-Feb 8.63 8.70 8.73 8.76 8.72 8.73 8.71 Mar-May 8.67 8.75 8.80 8.86 8.89 8.81 8.79 Jun-Aug 8.72 8.72 8.86 8.84 8.87 8.87 8.80 Sep-Nov 8.68 8.66 8.78 8.85 8.78 8.75 Mean 8.68 8.71 8.79 8.83 8.82 8.77 8.76 This table shows pigs per litter by quarter. Pigs per litter in the Jun-Aug quarter improved were identical to the same quarter last year, providing further evidence that productivity improvements in this variable may be leveling off.
Cold Storage Stocks This graph depicts the year to year percent change in cold storage stocks on the last day of the month. Stocks of all meats were relatively low throughout much of 2001.
Canadian Feeder Pig Imports This graph shows weekly Canadian feeder pig imports through weekending August 17. Canadian feeder pig imports are up 27% from this point in 2001.
Net Pork Exports As the industry approaches packer capacity in the 4th quarter, hog prices will be largely dependent on the packers ability to move their product. Export market will play a key role. February net pork exports dipped below year ago levels for the first time since 2000, and remained lower until July when exports surged, largely in anticipation of the safeguard quota scheduled for implementation on August 1.
USDA 4th Quarter Pork Production Outlook 1998 2002 Forecast % Change Forecast % Change Jan 4950 +3.9% 5175 -1.2% Feb 4950 +3.9% 5175 -1.2% Mar 4950 +3.9% 5175 -1.2% Apr 4950 +3.9% 5275 0.7% May 4950 +3.9% 5325 +1.6% June 4950 +3.9% 5375 +2.6% July 4950 +3.9% 5400 +3.1% Aug 5000 +4.9% 5400 +3.1% The August 4th quarter production forecast remained the same as the July forecast, which was revised upward for the fourth consecutive month. The current forecast projects 4th quarter production up 3.1% from 4th quarter 2001. The next forecast is scheduled for release September 12 and can be accessed at: http://www.ers.usda.gov/publications/waobr/view.asp?f=wasde-bb
USDA 4th Quarter Price Outlook 1998 2002 Low High Low High January 36 40 38 42 February 36 40 38 42 March 35 37 38 42 April 35 37 35 37 May 35 37 30 32 June 35 37 28 30 July 33 35 28 30 August 30 32 28 30 The 4th quarter price forecast was held constant in August for the 3rd consecutive month. USDA’s June forecast is 25% lower than the forecast released in March. Analysts are much more cautious about 4th quarter prices than at this point in the year during 1998. The next forecast is scheduled for release September 12 and can be accessed at: http://www.ers.usda.gov/publications/waobr/view.asp?f=wasde-bb