Download
1 / 16
160 likes | 392 Views
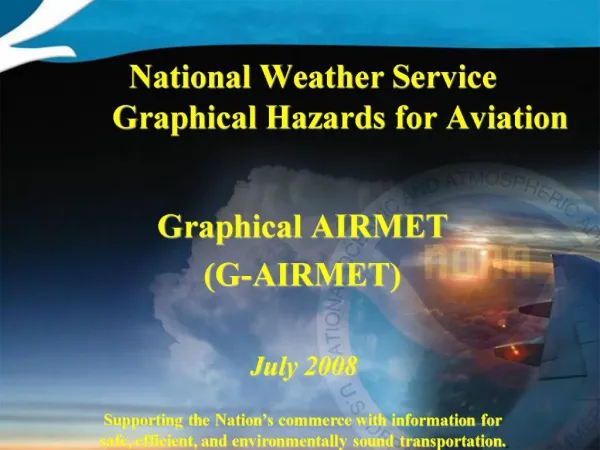
National Weather Service Graphical Hazards for Aviation. 12th Conference on Aviation Range and Aerospace Meteorology January 31, 2006. Jack May, Director Aviation Weather Center Steven R. Albersheim FAA Aerospace Weather Policy and Standards. G-AIRMET Objectives.

E N D
National Weather Service Graphical Hazards for Aviation 12th Conference on Aviation Range and Aerospace Meteorology January 31, 2006 Jack May, Director Aviation Weather Center Steven R. Albersheim FAA Aerospace Weather Policy and Standards
G-AIRMET Objectives • Enhance hazardous in-flight weather information over present text AIRMETs through Graphical representation of the AIRMET which adds Higher Frequency, Higher Resolution, Geo-Referenced Forecasts of hazardous weather information. • Specific Objectives • To represent AIRMET information to pilots, controllers, and dispatchers that represents hazard information more precisely and accurately than the corresponding text AIRMET. • Ensure graphical AIRMETs and corresponding text AIRMETs are consistent. • Adopt ICAO compliancy (FAA Administrator’s Flight Plan). • Lead international effort to produce graphical weather information
Simply Put… One Graphical AIRMETis worth a thousand contractions pilots don’t understand
G-AIRMET Characteristics • A collection of images and text which contain AIRMET weather criteria intended to be displayed graphically, and has the following characteristics: • Are many-sided horizontal polygons. • Each polygon has text attributes which describe: • A level top expressed in Flight Level or Indicated Altitude. • A base expressed in Flight Level, Indicated Altitude, or descriptive terms such as ‘freezing level’ or ‘surface’. • Describes the AIRMET hazard at a specific point in time, usually part of a time series separated by 3 hours. • Is formatted in BUFR (Binary Universal Format Representation) code (ICAO Recommendation for object oriented products).
G-AIRMET Characteristics • Packages information in the corresponding text AIRMET. Graphically adds precision to AIRMET that text cannot describe effectively. • Can be used for operational decisions. • Requires visualization software and interface to be seen (e.g., ADDS, cockpit display). • Can be integrated with other displays (earth-referenced coordinates).
Advantages of G-AIRMET • Users can view the AIRMET information graphically. • Users of G-AIRMET are able to visualize and apply AIRMET information with greater precision. Movement, growth, and dissipation of hazardous weather areas can be discerned by examining successive G-AIRMET products. • Not only where the AIRMET is, but where it is NOT during the six hour period.
Snapshot vs. Smear Example • A Weather hazard is moving and expanding from southwestern North Carolina and increasing in size. • The graphic representation of the text AIRMET at the top is forced to encompass this entire region for the full six-hour forecast period. • The G-AIRMET at the bottom is able to depict the precise position, size, and shape of the area at three distinct times within the same forecast period.
G-AIRMET Elements • Ceiling and Visibility (Graphical AIRMET Sierra) • IFR Ceiling • IFR Visibility • Mountain Obscuration • Icing (Graphical AIRMET Zulu) • Moderate Icing • Freezing Level Height(s) • Turbulence (Graphical AIRMET Tango) • Moderate Turbulence • Non-convective Low-level wind shear • Sustained surface wind greater than 30 knots
G-AIRMET Objects • G-AIRMET is object, not grid • High glance value • Attributes can be associated with the object • Bases/Tops, intensities, movements, identifiers, etc. • Small bandwidth required to communicate vs. grid • Excellent for representing discrete types of AIRMET information found in the text version
F00 F03 F06 Snapshot vs. Smear • G-AIRMET Snapshots Area of Text AIRMET • F00 + F03 + F06 = 6 h smear • G-AIRMET production = AIRMET snapshots in time • Snapshots turned into 6 hour smear • 6 h smear turned into Text AIRMET • Very Similar to current forecaster practice =
Graphical/Text AIRMET Issuance/Valid Times • Current Practice • Text AIRMET Valid Times • DT: 02-08, 08-14, 14-20, 20-02 UTC • ST: 03-09, 09-15, 15-21, 21-03 UTC • 6 hour Outlook • Amendments as required • Proposed • No Shift for DST • Text AIRMET Valid Times • ST: 03-09, 09-15, 15-21, 21-03 UTC • Graphical AIRMET Issued 8 times Daily • 6 hour Outlook • See schedule graphic • Amendments as required
Changes to Freezing Level in Text AIRMET • Freezing Level in AIRMET Zulu Text Information • Current Practice • Described by VOR points, except SFO area freezing levels indicated by state • Proposals to FAA • Today: Range of freezing level height across area • Multiple freezing levels identified • base and top of multiple freezing level layers included. • Standard freezing level height position • SFC, 4000, 8000, 12000, 16000 • From Low-level SIGWX • Depicted by VOR points
Changes to Outlook in Text AIRMET • Current Practice • Outlook area defined by geographic/ political descriptors using free form text • Proposed Practice • Time period contained within AIRMET • Outlook area defined by VOR points • Example • AIRMET TURB…NH VT MA CT NY PA OH WV VA MD DC DE NJ LE LO AND CSTL WTRS • FROM 40SE YSC TO 40E ECG TO HMV TO HNN TO CVG TO FWA TO DXO TO YYZ TO 60N SYR TO MSS TO 40SE YSC • MOD TURB BTN FL200 AND FL410. CONDS CONTG BYD 02Z THRU 08Z.
Graphically Representing AIRMET Sierra • IFR Ceiling and Visibility • Separate elements in G-Airmet • Combined for G-AIRMET when IFR CIG & VIS 6 hour smears overlap Graphical AIRMET IFR VIS & Graphical AIRMET IFR CIG = AIRMET Sierra • Separate IFR CIG & IFR VIS • Merge IFR CIG & VIS into IFR area • IFR area turned into text AIRMET G-Airmet IFR VIS G-Airmet IFR CIG Text IFR AIRMET =
Draft … Draft … DraftG-AIRMET “Takeoff” Plan • Update Resources and Documentation • Aeronautical Information Manual • Advisory Circular A-00-45 • Instrument Flying Handbook • FAA Pilot Exams • NWS Product Description Document • NWS Directives • Produce Verification Statistics • FAA Safety Analysis • Ensure training material is in place • Announcements and Notification • Provide vendor training for display visualization software • Update Aviation Digital Data Service • Duats? FS21? • Develop User ‘Help Desk’ for limited period of time after going operational. DRAFT
More Information • http://aviationweather.gov/testbed/g-airmet/ • Jack.May@noaa.gov • Clinton.Wallace@noaa.gov