Download
1 / 10
100 likes | 158 Views
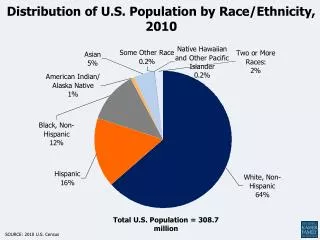
Distribution of Racial and Ethnicity Groups in the Northern Peninsula. Maps were taken from the New York Times online resource titled: Mapping America: Every City, Every Block (link: http://projects.nytimes.com/census/2010/explorer?ref=us).

E N D
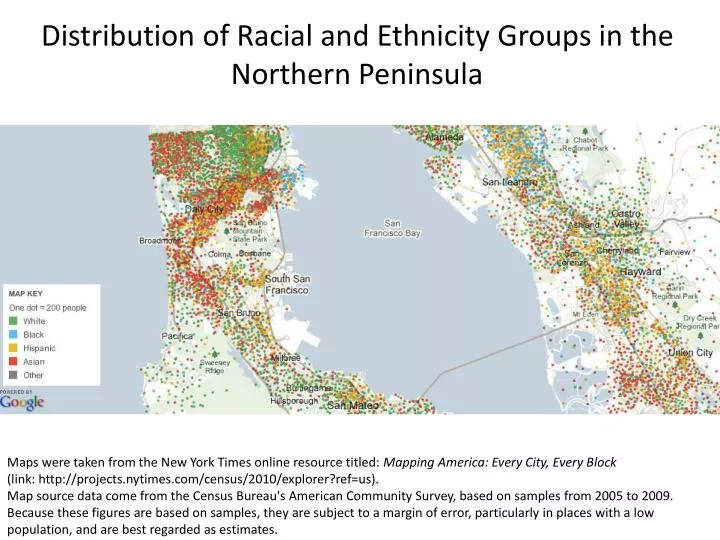
Distribution of Racial and Ethnicity Groups in the Northern Peninsula Maps were taken from the New York Times online resource titled: Mapping America: Every City, Every Block (link: http://projects.nytimes.com/census/2010/explorer?ref=us). Map source data come from the Census Bureau's American Community Survey, based on samples from 2005 to 2009. Because these figures are based on samples, they are subject to a margin of error, particularly in places with a low population, and are best regarded as estimates.
Distribution of Racial and Ethnicity Groups in the Southern Peninsula Maps were taken from the New York Times online resource titled: Mapping America: Every City, Every Block (link: http://projects.nytimes.com/census/2010/explorer?ref=us). Map source data come from the Census Bureau's American Community Survey, based on samples from 2005 to 2009. Because these figures are based on samples, they are subject to a margin of error, particularly in places with a low population, and are best regarded as estimates.
Distribution of Households Earning Under $30K in the Northern Peninsula Maps were taken from the New York Times online resource titled: Mapping America: Every City, Every Block (link: http://projects.nytimes.com/census/2010/explorer?ref=us). Map source data come from the Census Bureau's American Community Survey, based on samples from 2005 to 2009. Because these figures are based on samples, they are subject to a margin of error, particularly in places with a low population, and are best regarded as estimates.
Distribution of Households Earning Under $30K in the Southern Peninsula Maps were taken from the New York Times online resource titled: Mapping America: Every City, Every Block (link: http://projects.nytimes.com/census/2010/explorer?ref=us). Map source data come from the Census Bureau's American Community Survey, based on samples from 2005 to 2009. Because these figures are based on samples, they are subject to a margin of error, particularly in places with a low population, and are best regarded as estimates.
Distribution of Racial and Ethnicity Groups Skyline Maps were taken from the New York Times online resource titled: Mapping America: Every City, Every Block (link: http://projects.nytimes.com/census/2010/explorer?ref=us). Map source data come from the Census Bureau's American Community Survey, based on samples from 2005 to 2009. Because these figures are based on samples, they are subject to a margin of error, particularly in places with a low population, and are best regarded as estimates.
Distribution of Households Earning Under $30K Skyline Maps were taken from the New York Times online resource titled: Mapping America: Every City, Every Block (link: http://projects.nytimes.com/census/2010/explorer?ref=us). Map source data come from the Census Bureau's American Community Survey, based on samples from 2005 to 2009. Because these figures are based on samples, they are subject to a margin of error, particularly in places with a low population, and are best regarded as estimates.
Distribution of Racial and Ethnicity Groups CSM Maps were taken from the New York Times online resource titled: Mapping America: Every City, Every Block (link: http://projects.nytimes.com/census/2010/explorer?ref=us). Map source data come from the Census Bureau's American Community Survey, based on samples from 2005 to 2009. Because these figures are based on samples, they are subject to a margin of error, particularly in places with a low population, and are best regarded as estimates.
Distribution of Households Earning Under $30K CSM Maps were taken from the New York Times online resource titled: Mapping America: Every City, Every Block (link: http://projects.nytimes.com/census/2010/explorer?ref=us). Map source data come from the Census Bureau's American Community Survey, based on samples from 2005 to 2009. Because these figures are based on samples, they are subject to a margin of error, particularly in places with a low population, and are best regarded as estimates.
Distribution of Racial and Ethnicity Groups Cañada Maps were taken from the New York Times online resource titled: Mapping America: Every City, Every Block (link: http://projects.nytimes.com/census/2010/explorer?ref=us). Map source data come from the Census Bureau's American Community Survey, based on samples from 2005 to 2009. Because these figures are based on samples, they are subject to a margin of error, particularly in places with a low population, and are best regarded as estimates.
Distribution of Households Earning Under $30K Cañada Maps were taken from the New York Times online resource titled: Mapping America: Every City, Every Block (link: http://projects.nytimes.com/census/2010/explorer?ref=us). Map source data come from the Census Bureau's American Community Survey, based on samples from 2005 to 2009. Because these figures are based on samples, they are subject to a margin of error, particularly in places with a low population, and are best regarded as estimates.