Download
1 / 19
190 likes | 278 Views
Explore the K2K experiment, focusing on the beam line, near detector complex, SK events, neutrino energy spectrum, and conclusions. Understand the analysis strategy including error calculations and energy spectrum determination methods.

E N D
K2K Near Detector Analysis • Outline • Introduction • Beam line • Near detector complex • Expected number of SK events • Neutrino energy spectrum • Conclusions Kyoto Univ. Hirokazu Maesaka For The K2K Collaboration July 27, 2004
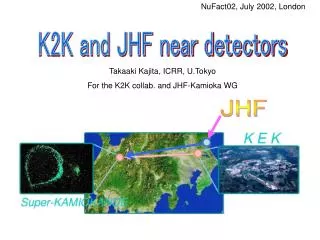
fixed K2K Experiment • Study nm nx oscillation • nm disappearance • Reduction of the number of events • Energy spectrum distortion (Using CC-QE interaction) • ne appearance ~250km <En>=1.3GeVnm 98% Super-K50kt watercherencov 12GeV nm + n m– + p K2K Near Detector Analysis
1.0 2.0 Beam Line Target & horns 200m 300m • Pion monitor • Gas cherenkov detector • To validate beam MC • Pion production • Far/Near flux ratio • Muon monitor • Ionization chamber and silicon pad • To monitor muon direction and yieldspill by spill. 250km nm p p+ m+ SK Decay tunnel Near detector Pion monitor Muon monitor Far/Near Ratio En(GeV) K2K Near Detector Analysis
+ 1 mrad – 1 mrad + 1 mrad – 1 mrad Muon Monitor Profile • Muon center is stable within 1mrad. Profile center X Profile center Y ’99 ’04 K2K Near Detector Analysis
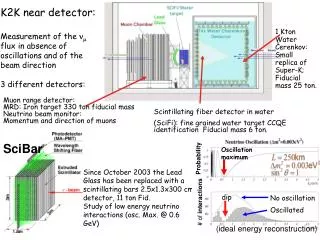
Lead Glass or Muon Range Detector (MRD) Near Detector Complex • 1KT: water cherenkov detector [25t fiducial] • SciFi: scintillating fiber and water target [6t fiducial] • LG: Lead glass calorimeter (removed in 2002) • SciBar: fully-active scintillator detector [10t fiducial] (installed in 2003) • MRD: Iron absorbers and drift tubes K2K Near Detector Analysis
Delivered Protons On Target • So far, 8.9 x 10¹⁹ POT has been accumulated for physics analysis. 100 80 Accumulated POT (x1018) SciBar installation 60 LG removal 40 K2K-IIb K2K-IIa 20 K2K-I 0 SK Rebuilding 5 Protons/Pulse (x1012) 0 1999 2000 2001 2002 2003 2004 K2K Near Detector Analysis
Analysis Strategy • The number of SK events: NSK • All interaction modes are used. • 1KT result is adopted. • Detector systematics are almost same as SK. • Neutrino energy spectrum • CC-QE interaction is used. • 1KT, SciFi, and SciBar data are fitted at the same time. • Both results are extrapolated to SK by using Far/Near ratio. K2K Near Detector Analysis
NSK(The Expected Number of SK Events) Far/Near ratio efficiency fiducial mass 1KT: 25 t SK: 22,500 t flux cross section Period NSK Error . K2K-I (Jun.99 – Jul.01) 79.1 +6.2 –5.4 K2K-II (Jan.03 – Feb.04) 71.8 +5.9 –5.1 All 150.9 +11.6 –10.0 K2K Near Detector Analysis
Systematic Errors on NSK • 1KT origin: +/– 4.7% • Fiducial volume error (4.0%) is dominant. • Live time correction by POT: K2K-I: +/– 0.6%, K2K-II: +/–0.3% • SK origin: +/– 3.0% • Fiducial volume error (2%) is dominant. • Far/Near ratio: +5.6 –7.3% • Spectrum shape: +4.0 –3.6% • Neutrino interaction model:+0.4 –1.1% Correlation is taken into account K2K Near Detector Analysis
Energy Spectrum Determination • Neutrino energy can be reconstructed from pm and qm for CC-QE event: V: nuclear potential energy • Fitting procedure • Select charged current events. • Fit (pm,qm) 2-dimensional histograms with MC templates, and obtain neutrino energy spectrum and non-QE/QE ratio. K2K Near Detector Analysis
m n DATA CC QE CC resonance p CC coherent-p CC multi-p Observed second track Dqp Expected proton direction assuming CCQE Event Selection p • 1KT (pm<1.5 GeV/c) • Fully-contained single ring m-like • SciFi and SciBar (pm>0.5 GeV/c) • 1-track • 2-track QE enhanced • 2-track non-QE enhanced n m Dqp SciBar 2-track non-QE QE degree K2K Near Detector Analysis
Deficit for forward going muons • Observed in non-QE enhanced samples • Possible source • CC resonance production mode • The best suppression factor: q2true/0.10[GeV2] (q2true<0.10) • CC coherent pionproduction mode • It should becompletely removed. In both cases, Data and MC agree well for all sub-samples. SciBar 2-track non-QE Reconstructed q2 assuming CC-QE K2K Near Detector Analysis
Strategy of Fitting • Neutrino energy spectrum is determined by requiring qm > 20deg. for 1KT andqm > 10deg. for SciFi and SciBar. • Non-QE/QE is obtained using entire qm region with low q2 correction. (En spectrum is fixed.)For oscillation analysis, the corrected MC is used. 1KT qm SciFi 1-track qm SciBar QE QE QE 10 20 10 K2K Near Detector Analysis
1KT data qm (deg.) pm (MeV/c) Fitting Method • nflux F(En) (8 bins) • ninteraction (nonQE/QE) • Detector systematic parameters Energy scale, Tracking efficiency, Nuclear effects EnQE (MC) nonQE(MC) MC templates 0-0.5 GeV 0.5-0.75GeV 0.75-1.0GeV • • • • K2K Near Detector Analysis
Fit Results c2=638.1 for 609 d.o.f • F1 ( En< 0.50) = 0.78 0.36 • F2 (0.50 En < 0.75) = 1.01 0.09 • F3 (0.75 En < 1.00) = 1.12 0.07 • F4 (1.00 En < 1.50) = 1.00 (fixed) • F5 (1.50 En < 2.00) = 0.90 0.04 • F6 (2.00 En < 2.50) = 1.07 0.06 • F7 (2.50 En < 3.00) = 1.33 0.17 • F8 (3.00En ) = 1.04 0.18 • non-QE / QE = 1.02 0.11 Additional nonQE/QE error of 10% is assigned based on the sensitivity of the fitted nonQE/QE value by varying the fit criteria. • q>10(20 ) cut: nonQE/QE =0.95 0.04 • CC-1p low q2 corr.: nonQE/QE =1.02 0.03 • No coherent p: nonQE/QE =1.06 0.03 10% K2K Near Detector Analysis
1KT qm 1KT pm data data MC MC CC-QE CC-QE 0 500 1000 1500 0 20 40 60 MeV/c deg. Basic Distributions (1KT) • Statistical error only. • Fitting errors are not shown. • Data and MC agree well K2K Near Detector Analysis
pm 1-track qm 1-track 0 1 2 3 0 20 40 60 pm 2-track QE qm 2-track QE 0 1 2 3 0 20 40 60 data pm 2-track non-QE qm 2-track non-QE MC CC-QE 0 1 2 3 GeV/c 0 20 40 60 deg. Basic Distributions (SciFi) • K2K-IIa data • Good agreement K2K Near Detector Analysis
0 1 2 3 0 20 40 60 0 1 2 3 0 20 40 60 data MC CC-QE 0 1 2 3 GeV/c 0 20 40 60 deg. Basic Distributions (SciBar) • Agree well K2K Near Detector Analysis
Conclusions • Neutrino beam profile has been stable. • Both the number of events and a neutrino energy spectrum are used for an oscillation analysis. • The number of expected SK events (1KT):150.9 +11.6 –10.0 • Neutrino energy spectrum at KEK has been determined. • Deficit is observed for forward going muons. • Either of CC resonance production mode or CC coherent p mode should be reduced. • The energy spectrum has been determined without small angle. • Non-QE/QE ratiohas been obtained with tuned MC. • The tuned MC is used for an oscillation analysis. K2K Near Detector Analysis