Download

1 / 24
240 likes | 317 Views
Dive into the economic forecast and trends for the Washington Area in 2006 and beyond, analyzing GDP, job markets, housing market, and economic outlook. Explore data, trends, and potential threats.

E N D
Spring MNCBIA Builder/Banker Breakfast The Washington Area Economy:2006 Forecast and Beyond Stephen S. Fuller, PhDDwight Schar Faculty Chair and University ProfessorDirector, Center for Regional Analysis School of Public Policy, George Mason University May 2, 2006
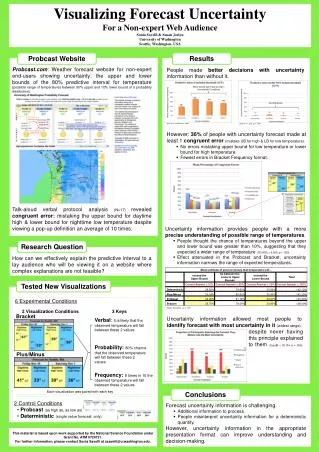
GDP 1995 - 2005 % Washington U.S. Source: GMU Center for Regional Analysis
Metro Comparisons Job Change 2000-200515 Largest Metro Areas Thousands WASHINGTON
15 Largest Job MarketsJob Change in 2005 Thousands Washington +64,700
Employment Change bySub-state Region (000s)(December 2005 Forecasts) (1) 1994-2004
Annual Job ChangeWashington MSA THOUSANDS Mar = +76,300
Benchmarking Job DataAnnual Job Change by Source Shaded cells are sample data. Yellow cells are final
Annual Change of EmployedWashington MSA THOUSANDS Feb= +96,800 Source: BLS Household Survey
The Washington Area Housing Market
Housing Price IndexWashington PMSA4th Quarter Each Year 1995 Q1=100 1997-2005 = +153 % 1990-1997 =+ 3.7 % Source: Federal Office of Housing Enterprise Oversight, GMU Center for Regional Analysis
Housing Price IndexAnnual % ChangeWashington PMSA4th Quarter Each Year 1995 Q1=100 28-Yr Average (compound rate) = 7.0% Source: Federal Office of Housing Enterprise Oversight, GMU Center for Regional Analysis
Average Sales PriceAll Housing TypesWashington Metro + 119% Since 1999 $ +5.8% +10.5% +13.6% +13.8% +20.1% +21.7% Source: MRIS, GMU Center for Regional Analysis
Average Sales Price Percent ChangeMonth-over-the-year, All types 2004-2005-2006Washington MSA % 28-yr Avg. = 7.0
Average Days on the Market ChangeMonth-over-the-year, All Types 2004-2005-2006Washington MSA 37 21 57
Total Unit Sales ChangeMonth-over-the-year, All Types 2004-2005-2006Washington MSA %
Housing Outlook for 2006 and 2007 Market will continue to cool – returning to “more Normal’: • 2006 Prices will increase in the range of 6% – 12% compared with 20+% in 2005 • Sales volume will drop back to 2002-2003 levels (98-100,000 transactions) • Days on Market rising to 45-55 average
GRP Forecast 2005 - 2010 % HIGH STANDARD LOW
Economic Outlook (GRP) – 2010Washington Area and Sub-state Portions(Annual % Change) % NV MSA SM DC
Employment Change bySub-state Region (000s) (1) 1995-2005
Local Threats to the Forecast • Global / National Forces • Labor Force Availability, Quality and Cost • Transportation Cost / Congestion • Federal Spending and Procurement Policy • BRAC • Housing Affordability and Supply