Download

1 / 24
240 likes | 309 Views
Spring MNCBIA Builder/Banker Breakfast. The Washington Area Economy: 2006 Forecast and Beyond. Stephen S. Fuller, PhD Dwight Schar Faculty Chair and University Professor Director, Center for Regional Analysis School of Public Policy, George Mason University. May 2, 2006.

E N D
Spring MNCBIA Builder/Banker Breakfast The Washington Area Economy:2006 Forecast and Beyond Stephen S. Fuller, PhDDwight Schar Faculty Chair and University ProfessorDirector, Center for Regional Analysis School of Public Policy, George Mason University May 2, 2006
GDP 1995 - 2005 % Washington U.S. Source: GMU Center for Regional Analysis
Metro Comparisons Job Change 2000-200515 Largest Metro Areas Thousands WASHINGTON
15 Largest Job MarketsJob Change in 2005 Thousands Washington +64,700
Employment Change bySub-state Region (000s)(December 2005 Forecasts) (1) 1994-2004
Annual Job ChangeWashington MSA THOUSANDS Mar = +76,300
Benchmarking Job DataAnnual Job Change by Source Shaded cells are sample data. Yellow cells are final
Annual Change of EmployedWashington MSA THOUSANDS Feb= +96,800 Source: BLS Household Survey
The Washington Area Housing Market
Housing Price IndexWashington PMSA4th Quarter Each Year 1995 Q1=100 1997-2005 = +153 % 1990-1997 =+ 3.7 % Source: Federal Office of Housing Enterprise Oversight, GMU Center for Regional Analysis
Housing Price IndexAnnual % ChangeWashington PMSA4th Quarter Each Year 1995 Q1=100 28-Yr Average (compound rate) = 7.0% Source: Federal Office of Housing Enterprise Oversight, GMU Center for Regional Analysis
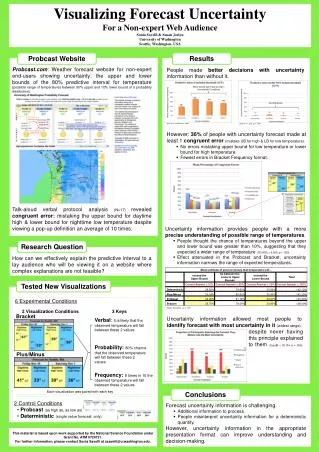
Average Sales PriceAll Housing TypesWashington Metro + 119% Since 1999 $ +5.8% +10.5% +13.6% +13.8% +20.1% +21.7% Source: MRIS, GMU Center for Regional Analysis
Average Sales Price Percent ChangeMonth-over-the-year, All types 2004-2005-2006Washington MSA % 28-yr Avg. = 7.0
Average Days on the Market ChangeMonth-over-the-year, All Types 2004-2005-2006Washington MSA 37 21 57
Total Unit Sales ChangeMonth-over-the-year, All Types 2004-2005-2006Washington MSA %
Housing Outlook for 2006 and 2007 Market will continue to cool – returning to “more Normal’: • 2006 Prices will increase in the range of 6% – 12% compared with 20+% in 2005 • Sales volume will drop back to 2002-2003 levels (98-100,000 transactions) • Days on Market rising to 45-55 average
GRP Forecast 2005 - 2010 % HIGH STANDARD LOW
Economic Outlook (GRP) – 2010Washington Area and Sub-state Portions(Annual % Change) % NV MSA SM DC
Employment Change bySub-state Region (000s) (1) 1995-2005
Local Threats to the Forecast • Global / National Forces • Labor Force Availability, Quality and Cost • Transportation Cost / Congestion • Federal Spending and Procurement Policy • BRAC • Housing Affordability and Supply