Proportional Relationships
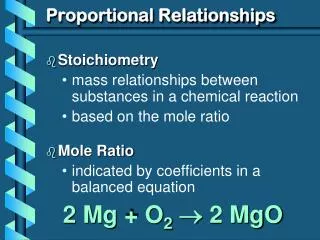
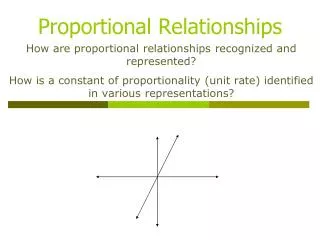
Proportional Relationships. How are proportional relationships recognized and represented? How is a constant of proportionality (unit rate) identified in various representations?. Definition: Y varies directly as x means that y = kx where k is the constant of proportionality.


Proportional Relationships
E N D
Presentation Transcript
Proportional Relationships How are proportional relationships recognized and represented? How is a constant of proportionality (unit rate) identified in various representations?
Definition: Y varies directly as x means that y = kx where k is the constant of proportionality. Another way of writing this is k = In other words: * the constant of proportionality (k) in a proportional relationship is the constant (unchanged) ratio of two variable quantities.
Examples of Proportional Relationship: What is the constant of proportionality of the table below? y = 2x is the equation!
Examples of Proportional Relationship: y = 3x is the equation! What is the constant of proportionality of the table above?
Examples of Proportional Relationship: OR y = .25x is the equation! What is the constant of proportionality of the table above?
Answer Now What is the constant of proportionality for the following table? • 2 • -2 • -½ • ½
Is this a proportional relationship of y? If yes, give the constant proportionality of (k) and the equation.
Is this a proportional relationship of y? If yes, give the constant proportionality of (k) and the equation. No! The k values are different!
Is this a proportional relationship of y? If yes, give the constant proportionality of (k) and the equation.
Is this a proportional relationship of y? If yes, give the constant proportionality of (k) and the equation. Cost of Iced-Tea Mix Yes! k = 475 cents Equation p = 4.75c
Answer Now Which of the following represent a proportional relationship? • A • B • C • D
Answer Now Which is the equation that describes the relationship in following table of values?
Using Proportional Relationship to find unknowns (y = kx) Given that y varies directly with x, and y = 28 when x=7, Find x when y = 52. HOW??? 2 step process Therefore: X =13 when Y=52
Using Direct Variation to find unknowns (y = kx) Given that y varies directly with x, and y = 3 when x=9, Find y when x = 40.5. HOW??? 2 step process Therefore: X =40.5 when Y=13.5
Using Direct Variation to find unknowns (y = kx) Given that y varies directly with x, and y = 6 when x=-5, Find y when x = -8. HOW??? 2 step process 2. Use y = kx. Find the unknown (x). y= -1.2(-8) x= 9.6 Therefore: X =-8 when Y=9.6
Using Direct Variation to solve word problems Problem: A car uses 8 gallons of gasoline to travel 290 miles. How much gasoline will the car use to travel 400 miles? Step One: Find points in table Step Three: Use the equation to find the unknown. 400 =36.25x 400 =36.25x 36.25 36.25 x = 11.03
Using Direct Variation to solve word problems Problem: Julio wages vary directly as the number of hours that he works. If his wages for 5 hours are $29.75, how much will they be for 30 hours Step One: Find points in table. Step Three: Use the equation to find the unknown. y=kx y=5.95(30) y=178.50
Proportional Relationships and its graph The equation that represents the constant of proportionality is y = kx The graph will always go through…
Yes No No No
Identify which of the following graphs represent a proportional relationship. Yes No No Yes
Which of the Following graphs represent a proportional relationship?
Does the following graph represent a proportional relationship? Explain your reasoning
Does the following graph represent a proportional relationship? Yes (20, 60) Find the constant of variation and equation (10, 30)
Write an equations that represents the proportional relationship between the time in class x and the number of pages y. Liana takes 2 pages of notes during each hour of class. Create a table & graph to represent the proportional relationship http://www.ixl.com/math/grade-8/proportional-relationships-word-problems
Peter earns $1.50 for every cup of lemonade he sells. Write an equation that shows the relationship between the number of cups sold x and the earnings y. Delfina's graduation picnic costs $35 for every attendee. Write an equation that shows the relationship between the attendees (a) and the cost (c). Sajan can bake 6 cookies with each scoop of flour. Write an equation that shows the relationship between the scoops of flour x and the cookies y. DJ's Auto Wash earns revenues of $4.50 per customer. Write an equation that shows the relationship between the number of customers x and the revenue y. Mitch can grow 150 wild flowers with every seed packet. Write an equation that shows the relationship between the number of seed packets (p) and the total number of wild flowers (w).