AS-interface
AS-Interface. AS-interface. Analyser. Diagnostics with AS-Interface. Lifetime of Installation. Commissioning. Operation / Maintenance. Fault. Diagnostics concept. Requirement. Fast fault repair Documentation Verification of function and quality Test protocols for release.

AS-interface
E N D
Presentation Transcript
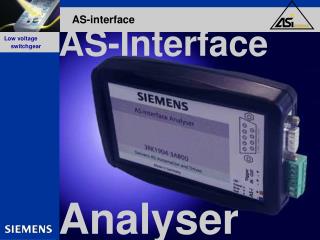
AS-Interface AS-interface Analyser
Diagnostics with AS-Interface Lifetime of Installation Commissioning Operation / Maintenance Fault Diagnostics concept Requirement • Fast fault repair • Documentation • Verification of function and quality • Test protocols for release • Preventive diagnostics • Identification of failed component • Verification of quality • Minimisation of service time • Fast fault repair • Cause of fault • Verification of function • Documentation Solution AS-Interface Analyser System Functions The AS-Interface analyser allows a complete diagnosis of AS-Interface networks during the whole lifetime of the installation. It is the ideal supplement for local diagnostics.
EMC FAULT IN COMMISSIONING CONTACTING Slave Parasitic inductions on AS-interface MASTER Slave Slave Function Slave • Defective Frames can not be detected by analysis of the physical layer • High fault tolerance of AS-interface compensates those faults • Analyser makes preventive diagnostics possible
Principle of function - ANALYSER MASTER Slave Slave Function Slave • RECORD COMMUNICATION: • Interpretation • Record • Represent • Document • Observe Analyser PC
Modes Function STATISTICS TRACE • DETAILED Analysis • Setting trigger conditions • Observe Communication on these conditions • Start the communication record • Detailed Analysis of failures with trace filters • ONLINE ANALYSIS • Simple Overview • Statistic Analysis of Failures • Overview of available Slaves • Representation of Slave Data and IDs „Complete Installation does not work correctly- WHAT IS THE REASON?“ „SIMON with sporadic E-STOPS - WHY?“
Statistic mode: network overview Statistic mode The error rate of available slaves is represented in a simple traffic light function: < 1% Faults per second 1..5 % Faults per second > 5 % Faults per second Slave not projected but present
Statistic mode: network overview with hold time • Same look and functionality as network overview • Adjustable hold time for faults • After this hold time, the error rate is evaluated again • Changes in the system are immediately visible Statistic mode
Satistic mode: data • All data actually transferred over the network is displayed • Representation without PLC/Host possible • Outputs displayed as process image or as AS-Interface level Statistic mode
Statistic mode: configuration • The I/O- and ID-Codes of the slaves are represented Statistic mode
Statistic mode: advanced statistics • The data of the overview function is represented numerically here. Statistic mode
TRACE mode: Procedure Enter trigger conditions Enter Record filter Offline Supervision of the system Trace mode RECORDING Download Trace on PC Enter View-Filter ANALYSIS
Trace mode: trigger conditions Initiating Trigger Protocol Initiating data Trigger Levels Trace mode Initiating slave Number of trigger conditions before the next trigger level is activated
Trace mode: recording • Recording is started independently from the PC. • Recording can be analysed offline exactly with extensive view filters. • The trigger position (start of recording) is variable Trace mode
Test Protocols • All data of the online statistics can be printed out as Test protocol sheets • The qualitiy of AS-Interface networks can thereby be documented • This allows a verification of the system state for releases or maintenance Test Protocols
Advantages / Benefits • The AS-interface analyser allows preventive inspections and therefore maintenance time and down time is reduced considerably • Fast fault repair is rendered possible by the intuitive representation in the statistical mode • Simple and comfortable use makes diagnostics of AS-interface networks possible without a specialist • Inspection sheets give a verification of the state and quality of the system for service and release • Recorded test protocol sheets make remote diagnostics easier by Technical Assistance. Furthermore, any settings of the analyser can be sent in one file per e-mail, whereby outstanding remote diagnostics are achieved • Numerous view filters and trigger functions with physical inputs and outputs make a detailed analysis possible • Process Data is visibleonline and commissionings are thereby accelerated, as it is possible to commission independently of host Advantages Benefits
Technical Data Interfaces AS-Interface RS 232 for interconnection with PC Trigger input (24 V) Trigger output (TTL) Displays / LEDs LED green (power) Supply voltage OK LED green (serial active) RS232 interface in operation LED green/red (test)Test mode Message buffer 256,000 AS-Interface-messagesRated operational current about 70 mA out of AS-Interface Rated insulation voltage > 500 VEMC according to EN50081-2, EN61000-6-2Ambient air temperature 0°C … +55°CStorage temperature -25°C … +70°CAS-Interface-specification V2.1 Technical data
Schedule / Ordering data • AS-INTERFACE ANALYSER: • RS232-cable for interconnection with PC • Diagnostics software (CD-ROM) • Beginning of delivery: Mid March 2003 • Order number: 3RK1904-3AB00 • List price: 1170,- EUR • ACCESSORIES: • AS-Interface branch M12 • 3RX9801-0AA00 • List Price: • Cable plug M12 (5m) • 3RX1672 • List Price: Ordering data