Download
1 / 31
310 likes | 471 Views
Agro-Food Export Competitiveness of the European Union Countries on the World Mark ets. Imre Fertő and Štefan Bojnec. Outline. Motivation Theoretical background Methodological issues Data and methodology Results Conclusions. Motivation. COMPETE FP7 Project

E N D
Agro-Food Export Competitiveness of the European Union Countries on the World Markets Imre Fertő and ŠtefanBojnec
Outline • Motivation • Theoreticalbackground • Methodologicalissues • Data and methodology • Results • Conclusions
Motivation • COMPETE FP7 Project • Decliningcompetitveness of the EU agriculture • e.g. Ball et al. 2010, EC 2007, FoodDrinkEurope 2011 • Investigatethe export performance using standard empirical trade analysistools
Dynamics of trade specialisation • HOS model • Trade pattern is stable over timeexcept random shockinrelativefactorendowments • New trade theory 1. • Grossman and Helpman (1990. 1991): longrun trade patternonlydependsontherelativefactorsendowments • New trade theory 2 • Krugman (1987) and Lucas (1988): international trade patternstendto be more specialised • Implications (Proudman –Redding (2000): • The dynamics of trade specialization is an empiricalquestion
Previousresearch • Fertő 2008 • Bojnec and Fertő (2008, 2009, 2010, 2011, 2012) • Török and Jámbor (2013)
Measuringcomparativeadvantage • Balassa index • B = (Xij / Xit) / (Xnj / Xnt) • X export • i product • j country • total export • n set of countries: world market • B>1. revealedcomparativeadvantage
Methodology • Descriptivestatistics • Impact of the EU enlargementin 2004 • Chowtests • Convergency: • Panel unit roottests • Stability of B indicesatproductlevel • Markovmatrices plus mobilityindices • Survivalanalysis
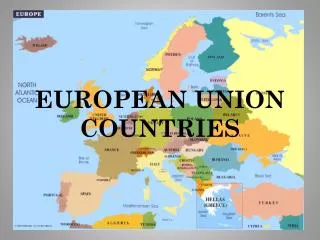
Data • Country coverage: EU27 • Period: 2000-2011 • Trade data • Comtrade-WITS. HS6. • Agri-food trade definedbythe WTO • 789 productgroups
Conclusions • Mean export growthrate is higherin NMS than OMS • Impact of EU enlargement is restrictedtoonly 5 of 27 countries • Convergencyincomparativeadvantage • Trade pattern is more mobile in NMS than OMS • Duration of comparativeadvantage is higherin NMS than OMS