Phasing
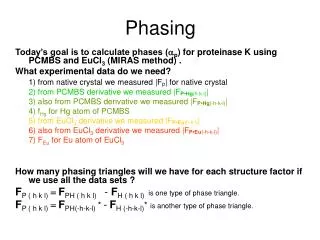
Phasing. Today’s goal is to calculate phases ( a p ) for proteinase K using MIRAS method (PCMBS and GdCl 3 ). What experimental data do we need? 1) from native crystal we measured |F p | for native crystal 2) from PCMBS derivative we measured |F PH1 (h k l) |


Phasing
E N D
Presentation Transcript
Phasing Today’s goal is to calculate phases (ap) for proteinase K using MIRAS method (PCMBS and GdCl3). What experimental data do we need? 1) from native crystal we measured |Fp| for native crystal 2) from PCMBS derivative we measured |FPH1(h k l)| 3) also from PCMBS derivative we measured |FPH1(-h-k-l)| 4) FH1 for Hg atom of PCMBS 5) from GdCl3derivative we measured |FPH2(h k l)| 6) also from GdCl3derivative we measured |FPH2(-h-k-l)| 7) FH2 for Gd atom of GdCl3 How many phasing triangles will we have for each structure factor if we use all the data sets ? FP ( h k l) =FPH ( h k l) - FH ( h k l) is one type of phase triangle. FP ( h k l) =FPH(-h-k-l) * -FH (-h-k-l)* is another type of phase triangle.
Four Phase Relationships PCMBS FP ( h k l)=FPH1 ( h k l)- FH1 ( h k l)isomorphous differences FP ( h k l)=FPH1(-h-k-l)*-FH1 (-h-k-l)*from Friedel mates (anomalous) GdCl3 FP ( h k l)=FPH2( h k l)-FH2 ( h k l)isomorphous differences FP ( h k l)=FPH2 (-h-k-l)*- FH2 (-h-k-l)*from Friedel mates (anomalous)
FP ( h k l) =FPH1 ( h k l) - FH1 (h k l) Imaginary axis |Fp ( h k l) | = 1.8 2 1 Real axis 2 -1 1 -2 -1 -2 Harker construction 1) |FP ( h k l)| –native measurement
FH FP ( h k l) =FPH1 ( h k l) - FH1 ( h k l) Imaginary axis |Fp ( h k l) | = 1.8 |FH ( h k l) | = 1.4 aH (hkl) = 45° |Fp | Real axis Harker construction 1) |FP ( h k l)| –native measurement 2) FH (h k l) calculated from heavy atom position.
|FPH| |FPH| FP ( h k l) =FPH1 ( h k l) - FH1 ( h k l) Imaginary axis |FP ( hkl) | = 1.8 |FH1 ( hkl) | = 1.4 aH1 (hkl) = 45° |FPH1 (hkl) | = 2.8 |Fp | Real axis FH Harker construction 1) |FP ( h k l)| –native measurement 2) FH1 (h k l) calculated from heavy atom position. 3)|FP1(hkl)|–measured from derivative. Let’s look at the quality of the phasing statistics up to this point.
|FPH| |FPH| Which of the following graphs best represents the phase probability distribution, P(a)? SIR Imaginary axis |Fp | a) b) c) 0 90 180 270 360 Real axis FH 0 90 180 270 360 0 90 180 270 360
|FPH| 90 |FPH| 0 180 270 The phase probability distribution, P(a) is sometimes shown as being wrapped around the phasing circle. SIR Imaginary axis |Fp | 0 90 180 270 360 Real axis FH
90 90 90 0 0 0 180 180 180 |FPH| 270 270 270 90 |FPH| 0 180 270 Which of the following is the best choice of Fp? SIR Imaginary axis a) b) c) |Fp | Real axis FH Radius of circle is approximately |Fp|
best F = |Fp|eia•P(a)da a |FPH| 90 |FPH| 0 180 270 SIR Imaginary axis |Fp | Real axis Sum of probability weighted vectors Fp Usually shorter than Fp FH
best F = |Fp|eia•P(a)da a 90 0 180 270 SIR Sum of probability weighted vectors Fp Best phase
90 0 180 270 SIR Which of the following is the best approximation to the Figure Of Merit (FOM) for this reflection? • 1.00 • 2.00 • 0.50 • -0.10 FOM=|Fbest|/|FP| Radius of circle is approximately |Fp|
90 0 180 270 Which phase probability distribution would yield the most desirable Figure of Merit? b) a) 0 + + 270 90 180 0 c) + 270 90 + 180
|FPH| FH |FPH| Phasing Power = |FH| Lack of closure SIR Which of the following is the best approximation to the phasing power for this reflection? Imaginary axis • 2.50 • 1.00 • 0.50 • -0.50 |Fp | Fbest Real axis |Fp | |FH ( h k l) | = 1.4 Lack of closure = |FPH|-|FP+FH| =0.5 (at the aP of Fbest)
|FPH| FH |FPH| Phasing Power = |FH| Lack of closure SIR Which of the following is the most desirable phasing power? Imaginary axis • 2.50 • 1.00 • 0.50 • -0.50 |Fp | Fbest Real axis |Fp | >1 What Phasing Power is sufficient to solve the structure?
|FPH| FH |FPH| SIR |FP ( hkl) | = 1.8 |FPHg (hkl) | = 2.8 Which of the following is the RCullis for this reflection? Imaginary axis • -0.5 • 0.5 • 1.30 • 2.00 |Fp | Fbest Real axis |Fp | RCullis = Lack of closureisomorphous difference From previous page, LoC=0.5 Isomorphous difference= |FPH|-|FP| 1.0=2.8-1.8
FH(-h-k-l)* FPH(-h-k-l)* SIRAS Isomorphous differences Anomalous differences To Resolve the phase ambiguity Imaginary axis FP ( h k l)=FPH(-h-k-l)*-FH (-h-k-l)* Fp (hkl) Real axis FH(hkl) We will calculate SIRAS phases using the PCMBS Hg site. FP –native measurement FH (hkl) and FH(-h-k-l) calculated from heavy atom position. FPH(hkl) and FPH(-h-k-l) –measured from derivative. Point to these on graph.
Imaginary axis 0 90 180 270 360 Fp (hkl) FH(-h-k-l)* Real axis FH(hkl) FPH(-h-k-l)* SIRAS Isomorphous differences Anomalous differences Which P(a) corresponds to SIR? Which P(a) corresponds to SIRAS?
Imaginary axis 90 90 0 0 180 180 Fp (hkl) 270 270 FH(-h-k-l)* Real axis FH(hkl) FPH(-h-k-l)* SIRAS Isomorphous differences Anomalous differences Which graph represents FOM of SIRAS phase? Which represents FOM of SIR phase? Which is better? Why?
A Tale of Two Ambiguities • We can solve both ambiguities in one experiment.
Center of inversion ambiguity • Remember, because the position of Hg was determined using a Patterson map there is an ambiguity in handedness. • The Patterson map has an additional center of symmetry not present in the real crystal. Therefore, both the site x,y,z and -x,-y,-z are equally consistent with Patterson peaks. • Handedness can be resolved by calculating both electron density maps and choosing the map which contains structural features of real proteins (L-amino acids, right handed a-helices). • If anomalous data is included, then one map will appear significantly better than the other. Note: Inversion of the space group symmetry (P43212 →P41212) accompanies inversion of the coordinates (x,y,z→ -x,-y,-z) Patterson map
Choice of origin ambiguity • I want to include the Gd data (derivative 2) in phase calculation. • I can determine the Gd site x,y,z coordinates using a difference Patterson map. • But, how can I guarantee the set of coordinates I obtain are referred to the same origin as Hg (derivative 1)? • Do I have to try all 48 possibilities?
Use a Cross difference Fourier to resolve the handedness ambiguity With newly calculated protein phases, fP, a protein electron density map could be calculated. The amplitudes would be |FP|, the phases would be fP.r(x)=1/V*S|FP|e-2pi(hx+ky+lz-fP) Answer: If we replace the coefficients with |FPH2-FP|, the result is an electron density map corresponding to this structural feature.
r(x)=1/V*S|FPH2-FP|e-2pi(hx-fP) • What is the second heavy atom, Alex. • When the difference FPH2-FP is taken, the protein component is removed and we are left with only the contribution from the second heavy atom. • This cross difference Fourier will help us in two ways: • It will resolve the handedness ambiguity by producing a very high peak when phases are calculated in the correct hand, but only noise when phases are calculated in the incorrect hand. • It will allow us to find the position of the second heavy atom and combine this data set into our phasing. Thus improving our phases.
Phasing Procedures • Calculate phases for site x,y,z of Hg and run cross difference Fourier to find the Gd site. Note the height of the peak and Gd coordinates. • Negate x,y,z of Hg and invert the space group from P43212 to P41212. Calculate a second set of phases and run a second cross difference Fourier to find the Gd site. Compare the height of the peak with step 1. • Chose the handedness which produces the highest peak for Gd. Use the corresponding hand of space group and Hg, and Gd coordinates to make a combined set of phases.
FH1(hkl) Isomorphous Deriv 2 FPH1(hkl) MIRAS FH1(-h-k-l)* FPH1(-h-k-l)* Imaginary axis FH2(hkl) FPH2(hkl) Fp (hkl) Anomalous Deriv 1 Real axis Isomorphous Deriv 1 GdCl3FPH = FP+FH for isomorphous differences
FH1(hkl) GdCl3FP ( h k l)=FPH1 (-h-k-l)*- FH1 (-h-k-l)* FPH1(hkl) Harker Construction for MIRAS phasing (Multiple Isomorphous Replacement with Anomalous Scattering) FH1(-h-k-l)* FPH1(-h-k-l)* Imaginary axis Isomorphous Deriv 2 FH2(hkl) FPH2(hkl) FH2 (-h-k-l)* FPH2(-h-k-l)* Fp (hkl) Anomalous Deriv 1 Real axis Isomorphous Deriv 1 Anomalous Deriv 2
FH1(hkl) For opposite hand FPH1(hkl) Note: in the presence of anomalous scattering, FH(HKL) ≠ FH(-H-K-L)* so if this opposite hand is the incorrect hand, the phase angle (aopposite) will be significantly different than (-aoriginal). The electron density would not just be inverted, but inverted and more noisy. FH1(-h-k-l)* FPH1(-h-k-l)* Isomorphous Deriv 1 Imaginary axis FH2(hkl) FPH2(hkl) Anomalous Deriv 2 FH2 (-h-k-l)* FPH2(-h-k-l)* Fp (hkl) Real axis Anomalous Deriv 1 Isomorphous Deriv 2
Density modification • A) Solvent flattening. • Calculate an electron density map. • If r<threshold, -> solvent • If r>threshold -> protein • Build a mask • Set density value in solvent region to a constant (low). • Transform flattened map to structure factors • Combine modified phases with original phases. • Iterate • Histogram matching
MIRAS phased map MIR phased map + Solvent Flattening + Histogram Matching
MIR phased map + Solvent Flattening + Histogram Matching MIRAS phased map
Density modification • B) Histogram matching. • Calculate an electron density map. • Calculate the electron density distribution. It’s a histogram. How many grid points on map have an electron density falling between 0.2 and 0.3 etc? • Compare this histogram with ideal protein electron density map. • Modify electron density to resemble an ideal distribution. Number of times a particular electron density value is observed. Electron density value
Y X Z Each grid point has a value r(x,y,z)
Y X Z represent r(x,y,z) in shades of gray How many grid points have density 0? How many grid points have density 1? How many grid points have density x?
r=4 n=1 r=3 n=5 r=0 n=60 r=2 n=17 r=1 n=6 r=6 n=12 r=7 n=2 r=8 n=4 r=9 n=1 r=5 n=2 r=10 n=25 ntotal=130 pixels total
0 1 2 3 4 5 6 7 8 9 10 Density (r) Histogram of electron density distribution P(r). Number of pixels with density (r)
Number of pixels with density (r) Density (r) Cumulative density distribution function N(r). Number of pixels with density < r 0 1 2 3 4 5 6 7 8 9 10 0 1 2 3 4 5 6 7 8 9 10 Cumulative density
Pixels with r=4 in original map will be modified to r= 2.5 in the histogram matched map. Histogram matching density distribution function N(r). Number of pixels with density < r Number of pixels with density < r Cumulative density observed Cumulative density ideal
Barriers to combining phase information from 2 derivatives • Initial Phasing with PCMBS • Calculate phases using coordinates you determined. • Refine heavy atom coordinates • Find Gd site using Cross Difference Fourier map. • Easier than Patterson methods. • Want to combine PCMBS and Gd to make MIRAS phases. • Determine handedness (P43212 or P41212 ?) • Repeat calculation above, but in P41212. • Compare map features with P43212 map to determine handedness. • Combine PCMBS and Gd sites (use correct hand of space group) for improved phases. • Density modification (solvent flattening & histogram matching) • Improves Phases • View electron density map