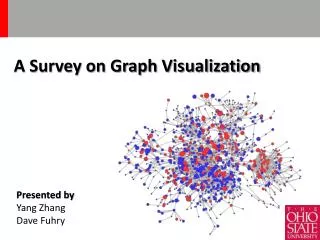
Survey Visualization
This project analyzes relationships between survey responses using data from the National Election Studies and Behavioral Risk Factor surveys. With 1,000 to 100,000 respondents and hundreds of questions, we utilize correlation statistics to measure the closeness between variables. Implemented with InfoVis and SGT Toolkits, our visualization enables users to explore correlations through a user-friendly interface. Users can view raw data, questionnaires, and filters to identify significant relationships, enhancing understanding of voter behavior and health factors.

Survey Visualization
E N D
Presentation Transcript
Survey Visualization Maria Tkatchenko CPSC 533C December 15, 2004
Problem • Survey composed of • Questionnaire • Collected data • Want to explore relationships between responses to various questions
Data set • National Election Studies center’s pre- and post-election surveys • National Center for Chronic Disease Prevention and Health Promotion Behavioral Risk Factor survey • 1K - 100K respondents • 100s of questions (dimensions)
Statistics • Correlation • measure of “closeness” of two sets of data • degree to which the association of two variables approaches a linear function • ranges from -1 to 1 • higher (absolute) value is better
Implementation • InfoVis Toolkit • SGT Toolkit • Java 2D and Swing • Data formats • CSV, converted to TQD • TXT