Download
1 / 14
140 likes | 163 Views
This study compares the fatigue life of three types of manual wheelchairs (depot, light, and ultralight) using ISO wheelchair testing standards. The results show significant differences in fatigue life, frame material, and types of failures. The findings can influence consumer choices and impact cost-effectiveness of manual wheelchairs.

E N D
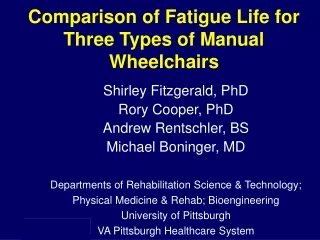
Comparison of Fatigue Life for Three Types of Manual Wheelchairs Shirley Fitzgerald, PhD Rory Cooper, PhD Andrew Rentschler, BS Michael Boninger, MD Departments of Rehabilitation Science & Technology; Physical Medicine & Rehab; Bioengineering University of Pittsburgh VA Pittsburgh Healthcare System
ISO Wheelchair Testing Standards for Fatigue Life • 200,000 Double Drum Cycles • 6,666 Curb-drop tester drops • Estimated that 200,000 & 6,666 curb drops = 3 years of wheelchair use
Failure in Fatigue Testing • Class I, II, & III Failures A chair is considered to fail the ISO standard if: • A class III failure occurs (chair is no longer able to function) -or- • 3 or more Class I or II failures occur
Methods • Three types of manual wheelchairs tested • Depot • Light • Ultralight • Fatigue testing completed on 64 different chairs • Notations made of all class I, class II, and class III failures • Data collected on type of material that wheelchair was made from & whether a frame failure occurred
Methods, continued • Results from testing entered into database • Statistical analysis: • Chi-squares • ANOVA • Survival curve for fatigue life
Survival Curves • Aimed at estimating probability of survival, death, or any other event that occurs over time in a particular group under surveillance for a particular outcome • Three types of chairs were considered ‘groups’ • Outcome was failure of the wheelchair • Event = the number of equivalent drum cycles (200,000) over time
Results • 64 wheelchairs tested • 23 depot • 27 ultralight • 14 lightweights • Number of Class failures • Class I: 21 • Class II: 29 • Class III: 45
Survival Curve Fatigue Life in Three Wheelchairs Types 1.2 1.0 .8 Cumulative Survival .6 Lightweight .4 Ultralight .2 Depot 0.0 0 50000 100000 150000 200000 250000 Equivalent Drum Cycles
Conclusion • Ultralight wheelchairs were significantly different than both lightweight and depot wheelchairs: • Fatigue life • Frame material • Type of class failures
Conclusion, continued • Results can influence the choice of a wheelchair for consumers • Results can impact cost-effectiveness of manual wheelchairs
Acknowledgements This study was funded in part by: • Paralyzed Veteran’s of America • NIDRR RERC on Wheelchairs • US Department of Veteran’s Affairs, Rehabilitation Research and Development Service
The End • Dr. Cooper: rcooper+@pitt.edu Review this lecture