Download
1 / 34
350 likes | 482 Views
Observations of Our Changing Planet: Weather EXTREMES. Professor Menglin Jin METR112: Global Climate Change. The Weather Extremes and Climate Change Video. http://www.met.sjsu.edu/metr112-videos/MET%20112%20Video%20Library-MP4/weather%20extremes/ Global Warming-1.mp4.

E N D
Observations of Our Changing Planet:Weather EXTREMES Professor Menglin Jin METR112: Global Climate Change
The Weather Extremes and Climate ChangeVideo • http://www.met.sjsu.edu/metr112-videos/MET%20112%20Video%20Library-MP4/weather%20extremes/ • Global Warming-1.mp4
Meehl et al. 2005 Science GCM simulated sea surface temperature and sea Level rise under different CO2 conditions Surface Air Temperature Surface will keep warming Sea level rise Sea level will keep rise
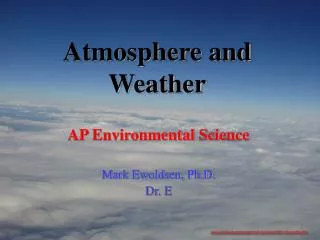
Definitions • Climate Change: • Changes in climate of the past, present or future associated with natural or anthropogenic (human) factors • Global Warming: • Warming of the 20th and 21st century associated with anthropogenic activities.
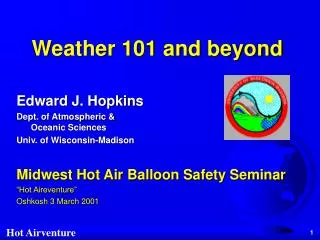
Weather describes whatever is happening outdoors in a given place at a given time. Weather is what happens from minute to minute. can change a lot within a very short time Weather includes daily changes in precipitation, barometric pressure, temperature, and wind conditions in a given location. Climate describes the total of all weather occurring over a period of years in a given place. Climate tells us what it's usually like in the place where you live Weather VS Climate
NASA Earth Satellite Provide tremendous Observations TRMM 11/27/97 Landsat 7 4/15/99 Aqua 5/4/02 Terra 12/18/99 Weather can be measured from space. Average of weather can get climate
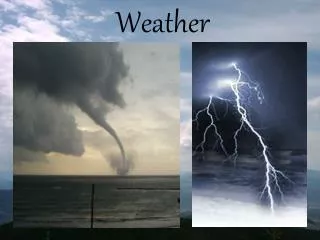
Weather Extremes • Hurricane • Flood • Snowfall • Drought • fire • etc what are the frequency and strength of extreme weather events in a changing climate
What does it mean by extreme? Extreme value distributions are often used to model the smallest or largest value among a large set of independent, identically distributed random values representing measurements or observations. frequency Extremes Climate value
NOAA Extreme Weather and Climate Events http://www.ncdc.noaa.gov/oa/climate/severeweather/extremes.html
Landsat 7 Observes Flooding in New OrleansHurricane Katrina September 7, 2005 September 15, 2005
Hurricane Ike was the third most destructive hurricane to ever make landfall in the United States. It was the ninth named storm, fifth hurricane and third major hurricane of the 2008 Atlantic hurricane season Category 4
Hurricane and SST Change Webster et al. report that the number of category 4 and 5 hurricanes has almost doubled globally over the past three decades (Webster et al, 2005, Science)
Hurricane and SST Change Emanuel, K. A. (2005), Nature Emanuel, K. A. (2005) reports that a measure of the power dissipated by tropical cyclones (proportional to the cube of wind speeds accumulated over the North Atlantic and western North Pacific basins) has approximately doubled since about 1950, with most of the increase occurring over the past 30 years. According to Emanuel, increases in both intensity and duration of tropical cyclones have contributed to this apparent increase. Emanuel's power dissipation index (PDI) is strongly correlated with sea surface temperatures in these basins, which have increased markedly over the same period. http://www.gfdl.noaa.gov/~tk/glob_warm_hurr.html
Be careful • Hurricanes are natural events, and are not linearly related to climate change • Climate change, by increase SST, indeed makes it more possible to have strong hurricane occur
Arctic sea ice coverage, 1979 and 2003 NASA http://www.learner.org/channel/courses/envsci/unit/text.php?unit=12&secNum=7
20-Year Trends in Arctic Sea Ice Coverage Yearly and Seasonal Ice Coverage Trends Yearly –2.8%/decade Winter –2.2%/decade Spring –3.1%/decade Summer –4.5%/decade Autumn –1.9%/decade • 37,000 km2/year decrease of sea ice area over a 19.4 year period observed from satellite Parkinson et al. (1999) and Vinnikov et al. (1999)
Deviation of Monthly Arctic Sea Ice Area22 years from Nimbus 7 to DMSP Seasonal Cycle Removed 1.0 0.5 0.0 Sea Ice Area (106 km2) -0.5 -1.0 -1.5 79 81 83 85 87 89 91 93 95 97 99 Year DMSP: Defense Meteorological Satellite program Parkinson et al. (1999)
Glaciers as a Harbinger of Global Change • Glacier National Park • 110 glaciers have disappeared in the past 150 years • 37 remaining glaciers expected to disappear within 25 years • Mt. Kilimanjaro • All glaciers likely to disappear within 20 years • 160,000 glaciers worldwide being monitored by satellites (especially Landsat 7/ETM+ and Terra/ASTER) Gangotri Glacier, Himalaya Bhutan-Himalaya
Land Cover Change in Florida1900 vs 1992 • Human influence has transformed southern Florida • Land converted to cropland and cities • Everglades transformed from deep-water sloughs and bog marsh into drier sawgrass marshes • Mangroves have shrunk dramatically
Crop and Property Damages from Natural Hazards1960 – June 2004 $/Square mile $14.5-$500 $500-$1,250 $1,250-$2,500 $2,500-$5,000 $5,000-$545,000 • San Francisco County ($26.8 million/square mile) • Los Alamos ($16.5 million/square mile) Hazards Research Lab, U of South Carolina
Summary and Resources • Satellites have played a crucial role in understanding and documenting global change • sources and sinks of carbon in the oceans and land • global surface and atmospheric temperature • sea ice extent and change • glacial retreat • hurricanes • Resource on Earth science, including news stories, images of the day, data sets, and natural hazards • earthobservatory.nasa.gov
The only way to have real success in science ... is to describe the evidence very carefully without regard to the way you feel it should be. If you have a theory, you must try to explain what's good about it and what's bad about it equally. In science you learn a kind of standard integrity and honesty. — Richard Feynman
What does it mean by extreme? Extreme value distributions are often used to model the smallest or largest value among a large set of independent, identically distributed random values representing measurements or observations. frequency Extremes Climate value
NOAA Extreme Weather and Climate Events http://www.ncdc.noaa.gov/oa/climate/severeweather/extremes.html