Download
1 / 16
160 likes | 364 Views
Renewables Go Big Big Wind. Christian Kjaer Chief Executive Officer European Wind Energy Association. European Parliament, 2 September 2009. Global Annual and Cumulative capacity (1996-2008). Global market for wind turbines in 2008: €35 billion. Annual wind energy installations MW.

E N D
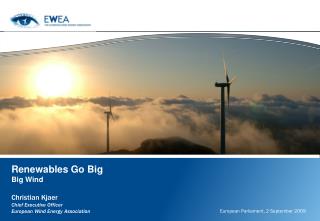
Renewables Go Big Big Wind Christian Kjaer Chief Executive Officer European Wind Energy Association European Parliament, 2 September 2009
Global Annual and Cumulative capacity(1996-2008) Global market for wind turbines in 2008: €35 billion
Annual wind energy installations MW Source: EWEA
Cumulative wind energy installations Source: EWEA
New power capacity additions 1999-2008 (EU-27, GW) Total installed: 200 GW GW 100,0 58,9 10,4 8,8 7,0 5,8 3,9 3,4 1,8 NaturalGas50% Wind 29% FuelOil 4% Nuclear 3% Hydro 2% Biomass 2% Other 1% Coal 5% Photo-Voltaic 4% Source: EWEA, EPIA and Platts PowerVision
New power generating capacity in 2008 (EU, GW) Total installed: 23,851 MW MW 8,484 6,932 4,200 2,495 762 473 296 149 60 Wind36% Gas 29% Coal 3% Hydro 2% Biomass 1% Other 1% Nuclear 0,3% Photo-voltaic 18% FuelOil 10% Source: EWEA, EPIA and Platts PowerVision
Wind development is similar to other power sources 18 years of global wind energy development (1991-2008) compared to the first 18 years of nuclear development (1961-1976) MW Annual WindAnnual NuclearTotal WindTotal Nuclear '61'91 '62'92 '63'93 '64'94 '65'95 '66'96 '67'97 '68'98 '69'99 '70'00 '71'01 '72'02 '73'03 '74'04 '75'05 '76'06 '77'07 '78'08 Source: EWEA – IAEE
Wind power installed in Europe by end of 2008 (cumulative) Source: EWEA, Pure Power (March 2008)
Wind Energy in EU-27 – status 2008 65 GW installed capacity, incl. 1.47 GW offshore Annual installations of 8.5 GW (43% of total), incl. 0.35 GW offshore Electricity production of 142 TWh Meeting 4.2% of total EU electricity demand Providing power equivalent to the needs of 35 million average EU households Avoiding 108 Mt of CO2 – equivalent to taking more than50 million cars off the road (20% of the EU car fleet) and equal to 31% of the EU-15’s Kyoto obligation Annual avoided fuel cost of €5.4 billion* Annual avoided CO2 costs of approximately €2.4 billion* Annual investments in wind turbines of €11 billion* *Source: Pure Power; Wind Energy Scenarios to 2030; EWEA March 2008; www.EWEA.org
How Much Renewable Electricity? How Much Wind Power? • 20% Renewable Energy by 2020 requires: • 35% electricity from RES • 25% heating from RES • 10% biofuels from RES • Electricity 2005: 15% incl. 10% large hydro and 3% wind • Excluding large hydro the share of renewable electricity must increase from 5% to app. 25%, in 15 years depending on power demand 1 EC baseline scenario EU demand (2020): 4163.7 TW/h
March 2009: EWEA increased its 2020 target from 180 GW to 230 GW (incl. 40 GW offshore) Rising energy demand and contribution from wind power 2000: 12.9 GW 2008: 66 GW 2020: 230 GW 14%-18% despite growing demand Demand: 4,107 TWh Two decades toinstall 0.9% of EUelectricity demand Demand: 2,577 TWh Accelerating pace: reaching 4.2% end 2008 Demand: 3,380 TWh Source: EWEA
2008 2009-2010 2011-2015 2016-2020 Average annual EU wind power installations required to reach 230 GW by 2020 20 18 16 14 12 10 2008level GW 8 6 4 2 0 Source: EWEA
New EWEA Target for the European Union • 230 GW wind power in 2020(including 40 GW offshore) • 600 TWh per year by 2020 • 14–18 % of EU Electricity Demand Requires app. €200 bn in non-R&D investments in 2009-2020 (€125 bn onshore / €75 bn offshore)
Three Major Global Challenges • Energy crisis and sustained high fuel prices • Environmental crisis (IPCC: 25-40% CO2 reduction) • Financial crisis And three major European Challenges: • App. 350 GW of new electricity generating capacity must be constructed before 2020 (50% of current total) • Increasing energy imports at higher cost • Ineffective competition in EU power market and insufficient investment in power infrastructure
Thank you very much for your attention www.ewea.org RENEWABLE ENERGY HOUSE 63-65 RUE D’ARLON B-1040 BRUSSELS T: +32 2 546 1940 F: +32 2 546 1944 E: ewea@ewea.org