Download
1 / 20
200 likes | 350 Views
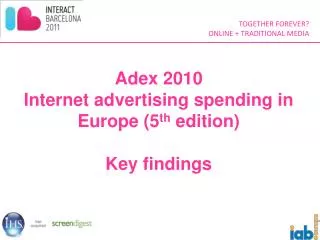
Ad Ex 2009 Internet advertising spending in Europe. Agenda. Topline figures Methodology Key trends. Topline Figures. The Results. 14.7 billion euros. Key facts and figures. €14.7bn market compared to €16.2bn in the US Growing +4.5% like-for-like, a slow-down from +20% in 2008

E N D
Agenda • Topline figures • Methodology • Key trends
The Results 14.7 billion euros
Key facts and figures • €14.7bn market compared to €16.2bn in the US • Growing +4.5% like-for-like, a slow-down from +20% in 2008 • But still outperforming all other media categories • Internet now contributes 18% to all media ad spend
A like-for-like growth rate of 4.5% • At constant country sample (19 countries of 2008) • At constant exchange rate +4.5% (like-for-like)
Europe catches up with the US as the US market declined in 2009 Source for USA data: IAB/PWC
Our European coverage now includes 23 countriesFour new countries added in 2009 • Austria • Belgium • Bulgaria* • Croatia • Denmark • Finland • France • Germany • Greece • Hungary • Italy • Netherlands • Norway • Poland • Russia* • Romania • Slovenia • Slovakia* • Spain • Sweden • Switzerland* • Turkey • UK *New in 2009
GROSS NET RATECARD Revenue Billed No Agency commissions Revenue Billed Campaigns x Ratecard Comparing “apples to apples”
Key challenges to ensure comparability • Fair Gross value • Category representation • Display • Search • Classifieds & Directories • Other • Exchange rate adjustments at a constant rate
Formats: Search drives growth during recession Note: Like-for-like growth is calculated excluding the new submissions (Bulgaria, Slovakia, Switzerland and Russia) for which no data was available in 2008.
+10% and above Markets: contrasting trends among emerging markets +5% to +10% 0% to +5% Online adspend growth 2009 -5% to 0%
Market: Growth and maturity 48% Germany UK *Calculated using Screen Digest Advertising Intelligence data which incorporates TV, print, radio, outdoor and cinema advertising
Thank you • For more information please contact Catherine Borrel, research@iabeurope.eu