Exploring the Relationship Between Education, Fertility, and Examination Results Across Provinces
This study investigates the correlations among education levels, fertility rates, and examination results among draftees, distinguishing between Catholic and Protestant provinces. By utilizing common standardized fertility measures and educational attainment statistics, we analyze whether higher education correlates with lower fertility rates. Additionally, we explore how examination performance varies across different educational backgrounds, using statistical plots and providing evidence to draw meaningful conclusions.


Exploring the Relationship Between Education, Fertility, and Examination Results Across Provinces
E N D
Presentation Transcript
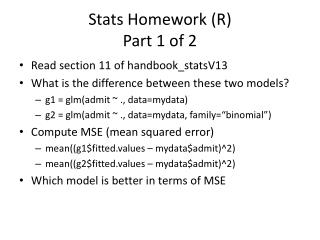
Stats Homework (R) • help(swiss) • Fertility • ‘common standardized fertility measure’ • Examination • % draftees receiving highest mark on army examination • Education • % education beyond primary school for draftees. • Catholic • % ‘catholic’ (as opposed to ‘protestant’) • Is there a relationship between education and fertility? • Draw appropriate conclusions • Provide appropriate evidence (plots, stats) • Is there a relationship between education and examination? • Is the relationship the same for Catholic and Protestant provinces? • Provide appropriate evidence (plots, stats)
http://www.nytimes.com/2009/01/07/technology/business-computing/07program.htmlhttp://www.nytimes.com/2009/01/07/technology/business-computing/07program.html
Plot Example • help(ldeaths) • plot(mdeaths, col="blue", ylab="Deaths", sub="Male (blue), Female (pink)", ylim=range(c(mdeaths, fdeaths))) • lines(fdeaths, lwd=3, col="pink") • abline(v=1970:1980, lty=3) • abline(h=seq(0,3000,1000), lty=3, col="red")
Periodicity • plot(1:length(fdeaths), fdeaths, type='l') • lines((1:length(fdeaths))+12, fdeaths, lty=3)
Type Argument par(mfrow=c(2,2)) plot(fdeaths, type='p', main="points") plot(fdeaths, type='l', main="lines") plot(fdeaths, type='b', main="b") plot(fdeaths, type='o', main="o")
ScatterPlot • plot(as.vector(mdeaths), as.vector(fdeaths)) • g=glm(fdeaths ~ mdeaths) • abline(g) • g$coef (Intercept) mdeaths -45.2598005 0.4050554
Hist & Density • par(mfrow=c(2,1)) • hist(fdeaths/mdeaths, nclass=30) • plot(density(fdeaths/mdeaths))
Data Frames • help(cars) • names(cars) • summary(cars) • plot(cars) • cars2 = cars • cars2$speed2 = cars$speed^2 • cars2$speed3 = cars$speed^3 • summary(cars2) • names(cars2) • plot(cars2) • options(digits=2) • cor(cars2)
Normality par(mfrow=c(2,1)) plot(density(cars$dist/cars$speed)) lines(density(rnorm(1000000, mean(cars$dist/cars$speed), sqrt(var(cars$dist/ cars$speed)))), col="red") qqnorm(cars$dist/cars$speed) abline(mean(cars$dist/cars$speed), sqrt(var(cars$dist/cars$speed)))
Stopping Distance Increases Quickly With Speed • plot(cars$speed, cars$dist/cars$speed) • boxplot(split(cars$dist/cars$speed, round(cars$speed/10)*10))
Quadratic Model of Stopping Distance plot(cars$speed, cars$dist) cars$speed2 = cars$speed^2 g2 = glm(cars$dist ~ cars$speed2) lines(cars$speed, g2$fitted.values)
Bowed Residuals g1 = glm(dist ~ poly(speed, 1), data=cars) g2 = glm(dist ~ poly(speed, 2), data=cars) par(mfrow=c(1,2)) boxplot(split(g1$resid, round(cars$speed/5))); abline(h=0) boxplot(split(g2$resid, round(cars$speed/5))); abline(h=0)
Help, Demo, Example • demo(graphics) • example(plot) • example(lines) • help(cars) • help(WWWusage) • example(abline) • example(text) • example(par) • boxplots • example(boxplot) • help(chickwts) • demo(plotmath) • pairs • example(pairs) • help(quakes) • help(airquality) • help(attitude) • Anorexia • utils::data(anorexia, package="MASS") • pairs(anorexia, col=c("red", "green", "blue")[anorexia$Treat]) • counting • example(table) • example(quantile) • example(hist) • help(faithful)
Randomness • example(rnorm) • example(rbinom) • example(rt) • Normality • example(qqnorm) • Regression • help(cars) • example(glm) • demo(lm.glm)