Download
1 / 31
310 likes | 627 Views
Introduction PM Data Analysis Workbook Design Goals Why PM Data Analysis by Individual States? Workbook Content. Introduction to the PM Data Analysis Workbook. Workbook Preparation Strategy Using the Workbook Motivating Examples Summary References.

E N D
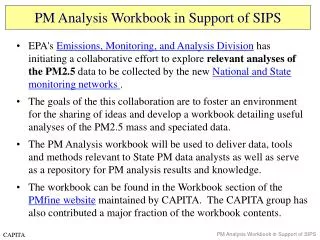
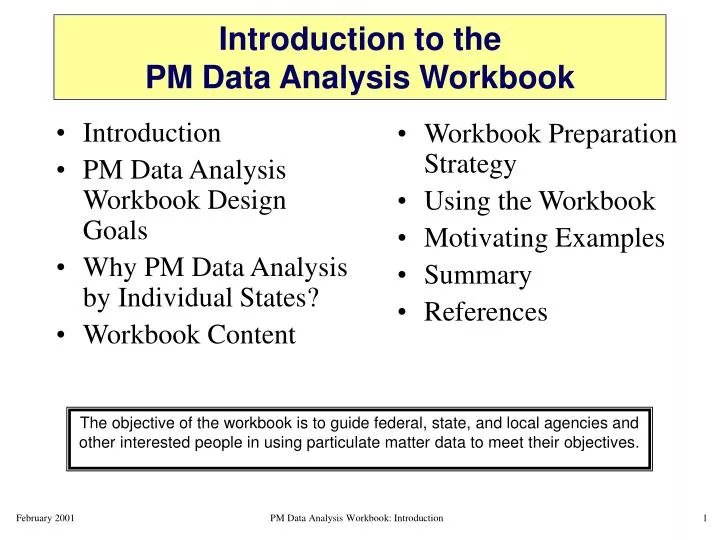
Introduction PM Data Analysis Workbook Design Goals Why PM Data Analysis by Individual States? Workbook Content Introduction to the PM Data Analysis Workbook • Workbook Preparation Strategy • Using the Workbook • Motivating Examples • Summary • References The objective of the workbook is to guide federal, state, and local agencies and other interested people in using particulate matter data to meet their objectives. PM Data Analysis Workbook: Introduction
Introduction Nature and sources of particulate matter. Particulate matter (PM) is the general term used for a mixture of solid particles and liquid droplets found in the air. These particles, which come in a wide range of sizes, originate from many different stationary, area, and mobile sources as well as from natural sources. They may be emitted directly by a source or formed in the atmosphere by the transformation of gaseous emissions. Their chemical and physical compositions vary depending on location, time of year, and meteorology. Health and other effects of PM. Scientific studies show a link between PM (alone or combined with other pollutants in the air) and a series of significant health effects. These health effects include premature death, increased hospital admissions and emergency room visits, increased respiratory symptoms and disease and decreased lung function, and alterations in lung tissue and structure and in respiratory tract defense mechanisms. Sensitive groups that appear to be at greater risk to such effects include the elderly, individuals with cardiopulmonary disease such as asthma, and children. In addition to health problems, PM is the major cause of reduced visibility in many parts of the United States. Airborne particles also can cause soiling and damage to materials. New PM standards. The primary (health-based) standards were revised to add two new PM2.5 standards, set at 15µg/m3 (annual) and 65 µg/m3 (24-hr), and to change the form of the 24-hr PM10 standard. The selected levels are based on the judgment that public health will be protected with an adequate margin of safety. The secondary (welfare-based) standards were revised by making them identical to the primary standards. In conjunction with the Regional Haze Program, the secondary standards will protect against major PM welfare effects, such as visibility impairment, soiling, and materials damage. PM composition. PM2.5 consists of those particles that are less than or equal to 2.5 µm in diameter. They are also referred to as "fine" particles. Fine particles result from fuel combustion from motor vehicles, power generation, and industrial facilities and from residential fireplaces and wood stoves. Fine particles can also be formed in the atmosphere by the transformation of gaseous emissions such as sulfur dioxide (SO2), nitrogen oxide (NOx), and volatile organic compounds (VOCs). Goals of PM2.5 monitoring. The goal of the PM2.5 monitoring program is to provide ambient data that support the nation's air quality programs, including both mass measurements and chemically resolved, or speciated, data. Data from this program will be used for PM2.5 National Ambient Air Quality Standard (NAAQS) comparisons, development and tracking of implementation plans, assessments for regional haze, assistance for studies of health effects, and other ambient PM research activities. U.S. EPA, 1999a, 1999b Summary on the next page. PM Data Analysis Workbook: Introduction
Introduction • Particulate matter (PM) is a general term for a mixture of solid particles and liquid droplets found in the air. • Scientific studies show a link between PM and a series of significant health effects. • The new standards for particles 2.5 m (PM2.5) are 15 g/m3 annual and 65 g/m3 24-hr. • PM2.5, fine particles, result from sources such as combustion and from the transformation of gaseous emissions such as sulfur dioxide (SO2), nitrogen oxide (NOx), and volatile organic compounds (VOCs). PM Data Analysis Workbook: Introduction
PM Data Analysis Workbook: Design Goals • Relevant. The workbook should contain materials that State PM data analysts need. • Technically sound. The workbook should be prepared and agreed upon by experienced PM analysts. • Educational. When presented, the workbook content should be articulated in a manner that enables PM data analysts to learn relevant new PM analysis techniques. • Practical. Beyond theory, the workbook should contain practical advice and reference to examples, tools, and methods. • Gateway. The core workbook should be a gateway to additional resources. • Evolving. The workbook should improve in time through feedback from the user communities. The on-line workbook and data analysis forum is available at <http://capita.wustl.edu/PMFine/>. Contributions to the workbook and site are encouraged and welcome! PM Data Analysis Workbook: Introduction
Why PM Data Analysis by Individual States? (1 of 2) • The new PM2.5 regulations will further increase the need to better understand the nature, causes, effects, and reduction strategies for PM. • States collecting data have unique “local” perspectives on data quality, meteorology, and sources, and in articulating policy-relevant data analysis questions. States also face • large quantities of complex new PM2.5 data, • large uncertainties about causes and effects, • immature nature and inherent complexity of analysis techniques, • importance of both local and transport sources for PM2.5, and • connections between PM2.5, visibility, ozone, climate change, and toxics. • Collaborative data analysis is needed to develop and support linkages among • data analysis “experts” , “novices” , and “beginners”, • data analysts, modelers, health researchers, and policymakers, • multiple states, regions, nations, environmental groups and industrial stakeholders, and • PM formation and transport, other criteria pollutants, health, and visibility. Poirot, 1999b PM Data Analysis Workbook: Introduction
Why PM Data Analysis by Individual States? (2 of 2) • Data analysis is needed at the regional and state level to assess • locations where air quality needs to improve • areal boundaries where controls might be applied • the need for incremental emission reductions • incremental air quality benefits of individual source category control measures PM Data Analysis Workbook: Introduction
Workbook Content • Introduction • Background • Ensuring High Quality Data • Quantifying PM NAAQS Attainment Status • Characterizing Ambient PM Concentrations and Processes • Quantifying Trends in PM and its Precursors • Quantifying the Contribution of Important Sources to PM Concentrations • Evaluating PM and Precursor Emission Inventories • Identifying Control Strategies to Meet the NAAQS for PM2.5 • Using PM Data to Assess Visibility • Glossary and Acronyms • Workbook References PM Data Analysis Workbook: Introduction
Workbook Preparation Strategy (1 of 2) • This workbook was designed to • Serve as an overview to the large topic of PM2.5 data analysis (not an official guidance document). Each topic area could be an entire workbook on its own. • Reflect a snapshot in time of the workbook available on the website. By design, the website will have the most current information. • For some topics, more information is provided by adding pages in 12 point font. A summary page in larger, presentation-friendly font is typically provided to summarize these information-laden pages. • References are provided for readers who want more detail. PM Data Analysis Workbook: Introduction
Workbook Preparation Strategy (2 of 2) • The workbook contains a different topic area in each section. Within the sections, the analyses are organized from less complex to more complex. • Figures are used to show example analyses. The figures are not intended to show the only way in which to perform an analysis but rather to provide the analyst with a starting point. • Most figure captions list the tool used to present the data, the data used in the analysis, an observation or interpretation point, and a reference. When a reference is not provided, the figure was prepared by the workbook authors specifically for the workbook. PM Data Analysis Workbook: Introduction
Using the Workbook (1 of 2) Decision matrix used to identify example activities that will help the analyst meet policy-relevant objectives. To use the matrix, find your policy-relevant objective at the top left. Follow this line across to see which example activities will be useful to meet the objective. For each of these activities, look down the column to see which data and data analysis tools are useful for the activity. Adapted from Main et al., 1998. PM Data Analysis Workbook: Introduction
Using the Workbook (2 of 2) Decision matrix continued. This portion of the matrix indicates the useful tools associated with each example activity. PM Data Analysis Workbook: Introduction
Motivating Examples • The following pages are excerpts from other chapters in this workbook. These examples illustrate key PM data analysis and validation issues. • Meaningful data analyses • Begin with the collection and reporting of valid data. • Proceed through an understanding of the chemical and physical processes related to PM formation, transport, and removal. • Evolve as more analysis techniques are applied to the data to obtain a consensus view of attainment and control issues. PM Data Analysis Workbook: Introduction
Data Validation Continues During Data Analysis • Two source apportionment models were applied to PM2.5 data collected in Vermont, and the results of the models were compared. • Excellent agreement for the selenium source was observed for part of the data while the rest of the results did not agree well. • Further investigation showed that the period of good agreement coincided with a change in laboratory analysis (with an accompanying change in detection limit and measurement uncertainty - the two models treat these quantities differently.) Poirot, 1999b PM Data Analysis Workbook: Introduction
Annual Standards Calculation A PM2.5 network with annual means calculated from quarterly means • Annual means are averaged across sites (spatial mean) before averaging across years. • This calculation assumes the site with 38% data completeness (Site 3, year 2) had less than 11 samples in each quarter. Thus, the 15.2 g/m3 annual mean was left out of the spatial mean calculation. • If we also assume that the site with 50% data completeness (Site 4, year 4) resulted in all quarters with at least 11 samples, then the 16.9 g/m3 annual mean at that site is included in the spatial mean. • The 3-yr mean rounds to 14.4 g/m3 which is less than the level of the standard of 15.0 g/m3. Fitz-Simmons, 1999 PM Data Analysis Workbook: Introduction
Episodic Patterns in PM • Investigations of episodes of high PM concentrations are necessary in order to understand the meteorological conditions and possible PM and precursor sources that lead to the high concentrations. • Unlike ozone episodes which typically occur during the summer, episodes of high PM2.5 concentrations can occur any time of year (e.g., winter wood smoke, summer photochemical event, etc.). Poirot et al., 1999 PM Data Analysis Workbook: Introduction
Sample Size and Day of Week Analysis • In the plot, boxes are notched (narrowed) at the median and return to full width at the lower and upper CI values. PM2.5 concentrations (in g/m3 measured using a beta attenuation mass monitor - BAM) are plotted by day of week. Data include samples collected during the hours beginning at 0700 and 0800 at an urban California site during October through December 2000. • At this site, concentrations were statistically significantly higher on Fridays than on other days. Possible reasons for this day of week pattern should be investigated. Mon. Sun. Notched box plot figure prepared using SYSTAT statistical package. The box represents the 25th and 75th percentiles. Whiskers extend to data within 1.5 times the interquartile range. The boxes are notched (narrowed) at the median and return to full width at the lower and upper confidence interval values (95% here). If the intervals around two medians do not overlap, one can be confident at about the 95% level that the two population medians are different Data are level 0. PM Data Analysis Workbook: Introduction
Seasonal Pattern of PM2.5 • The seasonal cycle results from changes in PM background levels, emissions, atmospheric dilution, and chemical reaction, formation, and removal processes. • Examining the seasonal cycles of PM2.5 mass and its elemental constituents can provide insights into these causal factors. • The season with the highest concentrations is a good candidate for PM2.5 control actions. Schichtel, 1999 PM Data Analysis Workbook: Introduction
Seasonal PM2.5 Dependence on Elevation in the Appalachian Mountains • In August, the PM2.5 concentrations are independent of elevation to at least 1200 m. Above 1200 m, PM2.5 concentrations decrease. (Note that elevation is not the only variable here.) • In January, PM2.5 concentrations decrease between sites at 300 and 800 m by about 50% . PM2.5 concentrations are approximately constant from 800 m to 1200 m and decrease another ~50% from 1200 to 1700 m. Schichtel, 1999 PM Data Analysis Workbook: Introduction
PM10 in the U.S. During the Central American Smoke Event 24-hr PM10 concentrations in g/m3 are shown for several cities. The likely smoke impact on these cities is highlighted. The horizontal line is at 65 g/m3 in each figure. Husar, 1999 PM Data Analysis Workbook: Introduction
Combining Spatial and Temporal Trends • The map shows the annual trends in overall PM2.5 concentration for 1988-1997 at 34 monitoring sites in the continental United States. These sites have been recording PM2.5 concentrations for over six years. • The site labels are the annual trends of PM2.5 concentrations at each site. The data were deseasonalized to "take out" the seasonal cycle of PM2.5. Frechtel et al., 1999 PM Data Analysis Workbook: Introduction
Discerning Natural vs. Anthropogenic Sources Using Spatial and Temporal Analyses Concentrations of PM2.5 iron with silicon, aluminum, and potassium at Chiricahua National Park in Arizona. • Fe and Al concentrations strongly correlate, suggesting a common source influence. Ratios are consistent with soil. • Fe and K concentrations do not correlate as well. The lower K:Fe ratio of 0.6 is indicative of soil. Higher ratios are consistent with woodsmoke. • Data corresponding to the July 4th weekend are highlighted. Poirot, 1998 MS Excel used to prepare scatter plot and calculate regression coefficients. PM Data Analysis Workbook: Introduction
Air Mass History Analysis Upwind probabilities for high aerosol arsenic at three Champlain Basin sites • Upwind probability plots for high arsenic concentrations at a site in Vermont (yellow dot in color versions) have a strong NW orientation at all three sites, pointing directly toward a smelter region. • The location of several large smelters are also identified in the plots (with the smelter identified as a green dot appearing to be the most likely contributor in color versions). • High arsenic levels appear to be excellent tracers for influence in the Lake Champlain Basin from the smelter region. Poirot et al., 1998 Shaded areas show 20%, 40%, and 60% of upwind probability on highest concentration day. Based on backward CAPITA Monte Carlo air mass histories for 1989-1995. PM Data Analysis Workbook: Introduction
UNMIX Analysis • UNMIX was applied to PM2.5 data collected at Underhill, Vermont, from 1988 to 1995. • Six “sources” were identified using mass (MF), particle absorption (BABS), arsenic (As), calcium (Ca), iron (Fe), nickel (Ni), selenium (Se), silicon (Si), total sulfur (S), and non-soil potassium (KNON). • The “sources” were further investigated by performing back trajectories and investigating time series. • The smelter (“smelt”) source, oil combustion, and winter coal combustion source trajectories are consistent with known emission patterns. Values represent the % of the element accounted for by the source. Based on backward CAPITA Monte Carlo air mass histories for Underhill, VT, on (25-30) days with highest UNMIX source contributions, 1989-1995. Poirot, 1999b PM Data Analysis Workbook: Introduction
Primary PM10/NOx Ambient Ratio Emission Inventory Ratio Comparison of the ambient- and emissions-derived PM10/NOx ratios in two cities are quite different. It appears as though PM10 is overestimated in the emission inventory by approximately a factor of two. Recommendation: the PM10 portion of the inventory should be investigated from the bottom-up. City #1 City #2 Case Study: Top-Down Emissions Evaluation Top-down comparison of ambient- and emissions-derived primary PM10/NOx in two cities. Note that this example corresponds to PM10; a similar comparison could be made for PM2.5 Haste et. al., 1998 PM Data Analysis Workbook: Introduction
CMB modeling results and emission inventory source apportionment are very different. The results of CMB modeling show that mobile sources are responsible for a much larger percentage of PM2.5 in the ambient air while the emission inventory data shows dust being the main contributor to PM2.5. These types of discrepancies are important to consider prior to control strategy development. Case Study: Using CMB to Assess Emission Estimates and Source Apportionment Watson et. al., 1998 PM Data Analysis Workbook: Introduction
Sulfate (g/m3) Bias (g/m3) Model Performance Evaluation • Mean daily variation in sulfate predictions and observations in this example show that the model predictions were greater than the ambient observations during most of the year. • The largest over-predictions occurred on Julian days 200-250 (mid- to late summer). • There are some occurrences when the model under-predicts. • The tendency for over-prediction is most easily seen in the bias display. Adapted from Wayland, 1999. PM Data Analysis Workbook: Introduction
What Pollutants Contribute to PM2.5 on Days When Visibility is Impaired? • Typical Rural Southwest. At the Grand Canyon National Park in Arizona, sulfates are still an important contributor to visibility impairment. However, note that crustal material is also an important contributor. • This figure shows the average composition of PM2.5 speciated samples on days with the worst visibility impairment in 1997. <http://www.epa.gov/oar/vis/grca_p.html> Data source = IMPROVE last accessed 10/10/00 PM Data Analysis Workbook: Introduction
Summary PM2.5 data can be used to meet a wide range of objectives. This workbook reflects a snapshot in time of the workbook available on the website and serves as an overview to the large topic of PM2.5 data analysis. The on-line workbook and data analysis forum is available at <http://capita.wustl.edu/PMFine/>. Contributions to the workbook and site are encouraged and welcome! PM Data Analysis Workbook: Introduction
References (1 of 3) Albritton D.L. and Greenbaum D.S. (1998) Atmospheric observations: Helping build the scientific basis for decisions related to airborne particulate matter. Chow J.C. (1995) Measurement methods to determine compliance with ambient air quality standards for suspended particles. J. Air & Waste Manage., 45, 320-382. Chow J.C. and Watson J.G. (1997) Guideline on speciated particulate monitoring. Report prepared by Desert Research Institute and available at <http://www.epa.gov/ttn/amtic/files/ambient/pm25/spec/drispec.pdf>. Fitz-Simmons T. (1999) How to calculate the particulate NAAQS. Paper presented at the National AIRS conference, San Francisco, May. Frechtel P., Eberly S., and Cox W. (1999) PM-Fine Trends at Long-Term IMPROVE Sites. Paper available at <http://capita.wustl.edu/PMFine/Workgroup/Status&Trends/Reports/Completed/LongTermIMPROVE/LongTermIMPROVE.html>. Haste T.L., Chinkin L.R., Kumar N., Lurmann F.W., and Hurwitt, S.B. (1998) Use of ambient data collected during IMS95 to evaluate a regional emission inventory for the San Joaquin Valley. Final report prepared for the San Joaquin Valleywide Air Pollution Study Agency and the California Air Resources Board, Sacramento, CA by Sonoma Technology, Inc., Petaluma, CA, STI-997211-1800-FR, July. Homolya J.B., Rice J., and Scheffe R.D. (1998) PM2.5 speciation - objectives, requirements, and approach. Presentation. September. Husar, R. (1999) Draft PM2.5 topic summaries available at <http://capita.wustl.edu/PMFine/Workbook/PMTopics_PPT/PMProperties/sld001.htm> <http://capita.wustl.edu/PMFine/Workbook/PMTopics_PPT/Pm25Formation/sld001.htm> <http://capita.wustl.edu/PMFine/Workbook/PMTopics_PPT/PMTransport/sld001.htm> <http://capita.wustl.edu/PMFine/Workbook/PMTopics_PPT/PMOrigin/sld001.htm> <http://capita.wustl.edu/PMFine/Workbook/PMTopics_PPT/PM10PM25Relationship/sld001.htm> <http://capita.wustl.edu/PMFine/Workbook/PMTopics_PPT/PMAnalysis/sld001.htm> <http://capita.wustl.edu/PMFine/Workbook/PMTopics_PPT/Pm25TransportROI/sld001.htm> <http://capita.wustl.edu/PMFine/Workbook/PMTopics_PPT/DiurnalPattern/sld001.htm> <http://capita.wustl.edu/PMFine/Workbook/PMTopics_PPT/WeeklyPattern/sld001.htm> <http://capita.wustl.edu/PMFine/Workbook/PMTopics_PPT/PMGlobalContPattern/sld001.htm> <http://capita.wustl.edu/PMFine/Workbook/PMTopics_PPT/NaturalEvents/sld001.htm> PM Data Analysis Workbook: Introduction
References (2 of 3) Lin J., Scheff P.A., and Wadden R.A. (1993) Development of a two-phase receptor model for VOC and PM10 air pollution sources in Chicago. Paper 93-A487 presented at the 86th annual meeting of the Air & Waste Management Assoc., Denver, June. Main H.H., Chinkin L.R., and Roberts P.T. (1998) PAMS data analysis workshops: illustrating the use of PAMS data to support ozone control programs. Web page prepared for the U.S. Environmental Protection Agency, Research Triangle Park, NC by Sonoma Technology, Inc., Petaluma, CA, <http://www.epa.gov/oar/oaqps/pams/analysis>, STI-997280-1824, June. Poirot R., Leston A., and Michaelsen C. (1999) August 1995 forest fire impacts in New England and Atlantic Canada. Report available at <http://capita.wustl.edu/NEARDAT/Reports/TechnicalReports/smoke895/895smoke.htm>. Poirot R., Wishinski P., Schichtel B., and Girton P. (1998) Air trajectory pollution climatology for the Lake Champlain Basin. Draft paper presented at 1998 symposium of the Lake Champlain Research Consortium. Available at <http://capita.wustl.edu/neardat/Reports/TechnicalReports/lakchamp/lchmpair.htm>. Poirot R. (1998) Tracers of opportunity: Potassium. Paper available at <http://capita.wustl.edu/PMFine/Workgroup/SourceAttribution/Reports/In-progress/Potass/ktext.html>. Poirot R. (1999a) Draft PM2.5 topic summary available at<http://capita.wustl.edu/PMFine/Workbook/PMTopics_PPT/PMAnlysisByStates/sld001.htm> Poirot R. (1999b) Personal communication. Schichtel B.A. (1999) PM2.5 topic summaries available at: <http://capita.wustl.edu/PMFine/Workbook/PMTopics_PPT/SeasonalPattern/sld001.htm> <http://capita.wustl.edu/PMFine/Workbook/PMTopics_PPT/ElevationDep/sld001.htm> <http://capita.wustl.edu/CAPITA/CapitaReports/USVisiTrend/80_95/USVistrnd80_95/index.htm> <http://capita.wustl.edu/Central-America/reports/SmokeSum/SmokeSumApr99/index.htm> PM Data Analysis Workbook: Introduction
References (3 of 3) U.S. Environmental Protection Agency (1999a) Particulate matter (PM2.5) speciation guidance document. Available at <http://www.epa.gov/ttn/amtic/files/ambient/pm25/spec/specpln3.pdf>. U.S. Environmental Protection Agency (1999b) General Information regarding PM2.5 data analysis posted on the EPA Internet web site <http://www.epa.gov/oar/oaqps/pm25/general.html>. Watson J.G., Fujita E.M., Chow J.C., Zielinska B., Richards L.W., Neff W., and Dietrich D. (1998) Northern Front Range Air Quality Study. Final Report. Prepared for Colorado State University, Cooperative Institute for Research in the Atmosphere, Fort Collins, CO. Desert Research Institute, Reno, NV. Wayland R.J. (1999) REMSAD - 1990 Base case simulation: model performance evaluation. Draft report prepared by U.S. Environmental Protection Agency, Office of Air Quality Planning and Standards, Research Triangle Park, NC, March. PM Data Analysis Workbook: Introduction