Download
1 / 5
50 likes | 167 Views
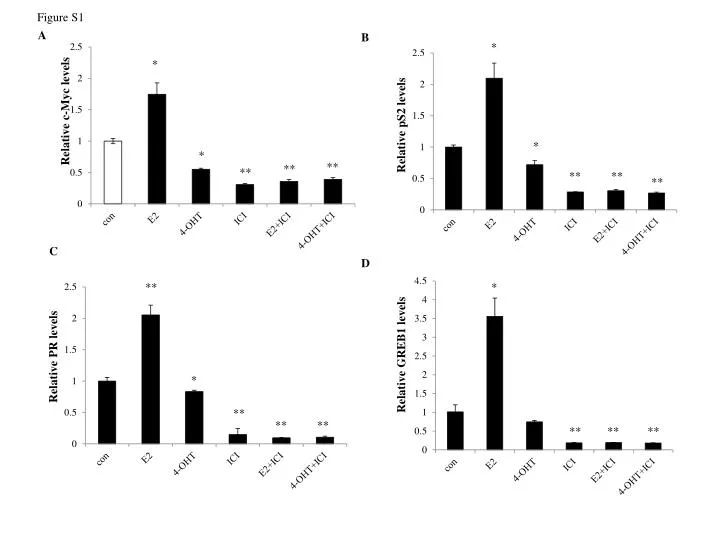
Figure S1. A. *. B. Relative pS2 levels. *. **. **. **. C. D. **. *. *. Relative c- Myc levels. Relative PR levels. Relative GREB1 levels. *. *. **. **. **. **. **. **. **. **. **. Figure S2. MCF-7 cells. B. A. **. C. MCF-7:PF cells. Relative pS2 levels. *.

E N D
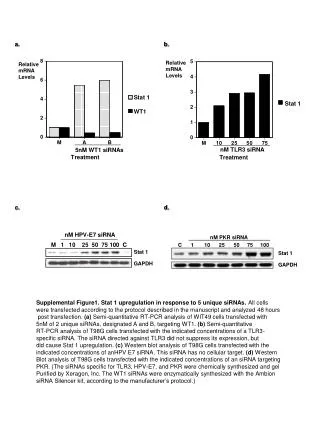
Figure S1 A * B Relative pS2 levels * ** ** ** C D ** * * Relative c-Myc levels Relative PR levels Relative GREB1 levels * * ** ** ** ** ** ** ** ** **
Figure S2 MCF-7 cells B A ** C MCF-7:PF cells Relative pS2 levels * MCF-7:5C cells ** Relative pS2 levels * Relative pS2 levels
Figure S3 con E24-OHT p-c-FosSer 32 p-c-Jun Ser63 β-actin
Figure S4 4-OHT - + - + A B PP2 - - + + ** ** ** ** DNA content (% of control) DNA content(% of control) ** E C D DNA content (% of control) p-STAT3 Tyr705 p-FAK Tyr397 β-actin ** Plasma membrane Cytoplasm Nucleus MCF-7:5C MCF-7:5C MCF-7:PF MCF-7:PF MCF-7:5C MCF-7:PF ERα Markers CD-73 LDH-A Lamin-A/C
Figure S5 con PP2 IB: 4G10 IP:IGF1-Rβ IB:IGF1-Rβ