
Plant Community Recovery in Mojave Desert: Red Rock Fire Study
Documenting post-fire recovery patterns in Mojave ecosystems, comparing blackbrush and creosote-bursage plant communities after the Red Rock Fire of 1993. Explore vegetation regeneration post-fire and the impact of invasive grass species.

Plant Community Recovery in Mojave Desert: Red Rock Fire Study
E N D
Presentation Transcript
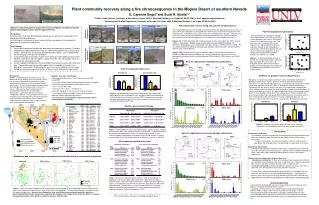
Environmental Studies Department Red Rock fire - 2005 Fire 4322 – 1983 Plant community recovery along a 30 year fire chronosequence We conducted NMS analyses for blackbrush and creosote-bursage plant communities to assess if plant community composition (as calculated from relative cover) returned to that equivalent to the unburned sites. In blackbrush sites, communities were still different after 30 years. However, after just 15 years plant community composition in creosote communities was similar to unburned communities, even though whole plot cover is still lower than in unburned plots (see fig. 2.) 1993 Red Rock fire • Objective: Document patterns of post-fire recovery in Mojave ecosystems to better inform land managers about what to expect after fires. • Predictions: • Communities that were dominated by creosote pre-fire will recover more quickly than those dominated by blackbrush. • Invasive grass red brome (Bromus rubens) will be more prominent in burned plots, promoting the “grass-fire cycle” theory. • Key Findings: • Pre-fire plant community composition determines the trajectory of recovery. Creosote and blackbrush dominated communities are colonized by different early successional species, although they share some common abundant species such as globemallow, desert marigold, and virgin river brittlebush. • Creosote-bursage communities recover more quickly than do blackbrush communities. However, blackbrush did re-establish in about half of the sites we sampled, which is a phenomenon rarely documented. • As with vegetative composition, Bromus establishment post-fire varies with community type. Creosote-bursage communities appear more susceptible to invasion than blackbrush communities. Evidence for the grass-fire cycle in Mojave systems seems limited to creosote-bursage communities, at least in years with low-average rainfall. Post-fire blackbrush regeneration Blackbrush Communities Generally, blackbrush vegetation is thought not to regenerate post-fire, at least not within several decades at the earliest. We found a range of re-establishment across our study, with some sites having over 20% of the original cover regenerated within 30 years, and others having no sign of blackbrush regeneration. We will be analyzing soils and other environmental components to work toward understanding which conditions blackbrush establishes in unaided. (a) Unburned Burned Unburned Burned Figures 3 & 5. NMS ordinations with overlaid joint plots for fires in the 1980’s (a), 1990’s (b) and 2000’s (c) year groups. Multiple response permutation procedure (MRPP) analyses for differences among groups were conducted for each plot. Groups are different when p < 0.05. The “A” statistic denotes the difference among groups (burned or unburned), with 1 being completely different, and -1 being identical. Figures 4 & 6. Relative cover of the most abundant species (defined by natural breaks) in blackbrush (Fig. 4) and creosote (Fig. 6) sites. Relative abundance and time since fire are expressed by decade of burn for unburned plots (a), 2000’s fires (b), 1990’s fires (c), and 1980’s fires (d). Post-fire regeneration in blackbrush communities Unburned Burned MRPP A = 0.20 P = 0.00 MRPP A = 0.29 P = 0.00 MRPP A = 0.19 P = 0.00 1990’s 1980’s 2000’s Tramp fire – 2005 Ghost fire – 1988 * Christmas fire – 1993 (3b) (3a) (3c) Creosote-bursage Communities (b) Figure 7. (a) Relative blackbrush cover in burned sites compared to adjacent unburned plots (averaged within each burn). (b) Proportion of plots within each fire where blackbrush was present post-fire compared to the proportion with blackbrush presence in unburned plots. MRPP A = -0.02 P > 0.05 Unburned Burned Burned Unburned Plant community recovery along a fire chronosequence in the Mojave Desert of southern NevadaE. Cayenne Engel1 and Scott R. Abella1,21 Public Lands Institute, University of Nevada Las Vegas, 4505 S. Maryland Parkway, Las Vegas, NV 89154-2040, e-mail: cayenne.engel@unlv.edu2 Environmental Studies Department, University of Nevada Las Vegas, 4505 S. Maryland Parkway, Las Vegas, NV 89154-2040 • Methods: Fire effects monitoring • We sampled 32 fires across Clark County, NV winter 2007 - spring 2009 • Fires were limited to those in Mojave plant communities including creosote-bursage and blackbrush dominated systems. • Fires occurred 1980 - 2007 • Size ranges from ~30 ac – ~82,000 acres • Elevation, topography, and soil vary (soil data not shown) • The inherent variation included in landscape scale analyses is important to detect generalizeable patterns • In our analyses, we grouped fires by natural breaks, which correspond to burn decades. Post-fire whole-plot foliar cover Background: Wildfires are becoming more prevalent across the Mojave desert, particularly in the last 30 years, due in part to increased human presence and increased abundance of exotic grasses which may be linked to wetter years. The last three decades have been wetter than average due to increased winter el niño rain events. Little work has been conducted on the consequences of these fires on native plant communities, successional patterns for natural revegetation, and links to the prevalence of future fire. Therefore, we examined patterns driving fire recovery at the landscape scale with the ultimate goal of understanding the Mojave system in order to inform post-fire management prescriptions. Burned (4a) (4b) Creosote-bursage Blackbrush Unburned MRPP A = 0.16 P = 0.00 MRPP A = -0.03 P > 0.05 Evidence for grass-fire cycle in Mojave burns We did not see greater abundance of Bromus rubens immediately following fire in blackbrush communities (fig. 8a). However, within 30 years post-fire Bromusabundance re-established to unburned levels. Creosote-bursage communities showed trends toward greater annual grass cover in burned than unburned communities immediately (fig. 8b). Annual rainfall in the years that sampling was conducted was either average or below-average, therefore we would not expect a great abundance of invasive annual grasses overall. Our data indicate that in years of low-average rainfall, brome is more abundant in older burns than younger burns. There is evidence that post-fire communities may have greater brome abundance than intact communities in years of increased rainfall, but the grass fire-cycle is contingent upon years of abnormally high rainfall, which may be less frequent with impending climate change. (4c) (4d) Unburned 2000’s Fires Figure 2. Whole-plot cover recovered to nearly 60% of the original cover within about 15 years in blackbrush sites, but did not recover beyond that up to 30 years post-burn. Cover in the single 1980’s creosote site recovered to the equal abundance of unburned sites, with a progressively lower rate of recovery with decreasing fire age. Blackbrush Creosote (b) (a) Post-fire diversity and richness 1990’s Fires 1980’s Fires Nevada 29 27 12 Troy Phelps, BLM Las Vegas 28 Las Vegas 24 17 6 31 5 13 19 16 11 2 Figure 8. Proportion of Bromus cover in burned versus unburned communities in a) blackbrush and b) creosote-bursage communities. 22 8 23 4 15 32 3 1 25 9 2000’s 1980’s Table 1. In both blackbrush and creosote communities, species richness (number of species per 100 m2 plot) and diversity differ through time. Creosote dominated communities regained species richness to unburned levels within 15 years, whereas blackbrush communities had greater diversity and richness in burned communities due to a lack of dominance of the blackbrush (see fig. 4 and fig. 6) 1990’s 20 post-fire regeneration in creosote-bursage communities • Conclusions • Community composition • As predicted, community composition and regeneration rates differed between the two major community types that dominate the middle-elevation Mojave desert ecosystems. • Creosote communities recovered more quickly in terms of relative species abundance and whole-plot cover than did blackbrush dominated communities. • Blackbrush regeneration • We observed evidence of blackbrush regeneration in approximately half the plots, up to 20% of original cover within 30 years. However, others exhibited no blackbrush return. More work needs to be done to determine why certain sites promote regeneration. • Bromus invasion (support for the grass-fire cycle) • Blackbrush communities: In years with average or below average rain, Bromus is less abundant in recently burned sites than in unburned sites. However, abundance does increase with time since burn to reach levels in unburned sites. • Creosote communities: Bromus abundance in burned sites was greater than in unburned sites, with abundance increasing with time since burn. . • Earlier reports indicate that blackbrush generally does not re-establish after fire, often with invasive grasses as the most abundant colonizers. We found these patterns to be inconsistent, with Bromus abundance initially lower in burned than unburned sites, and evidence of blackbrush re-establishment in many burned sites. 10 30 14 21 5c) Which species establish after fires? 5b) 5a) 26 18 7 Blackbrush and creosote-bursage communities have different post-fire successional trajectories 1990’s Fires 1980’s Fires 2000’s Fires Unburned 2004 - 2006 Blackbrush 1993 - 1995 Years of burns Unburned 2000’s Fires (6a) (6b) 1980-1988 Creosote US Forest Service Bureau of Land Mgmt Fish and Wildlife Service National Park Service Table 2. Results from indicator species analyses (ISA) for burned plots in blackbrush and creosote dominated communities. We present the top five indicator species (those with highest ISA values). Higher ISA values represent species associated more with burned sites than with unburned sites within each community type. The ISA value is a metric that describes the % of perfect indication, based on combining values for relative abundance and relative frequency (based on Dufrene and Legendre, 1997). 1990’s Fires 1980’s Fires (6d) (6c) • Acknowledgements • We thank Nick Bechtold, Adria Decorte, Teague Embry, Kate Prengaman, Chris Roberts, and Sarah Schmid for field assistance. • Sampling of three of the fires was funded through a cooperative agreement between BLM Las Vegas and the University of Nevada Las Vegas. A weed monitoring effort through the Weed Sentry program, funded through the Clark County Multiple Species Habitat Conservation Plan and a cooperative agreement between Lake Mead National Recreation Area, also supported surveys on some fires Figure 1. NMS (non-metric multidimensional scaling) ordinations of blackbrush (brown diamonds) and creosote-bursage (green circles) dominated communities in each of three burn year groupings. The two community types have different post-fire species compositions. Because the communities have very different successional trajectories, we will be presenting blackbrush and creosote data separately. We only have one sample of a fire from the 1980’s in creosote-bursage communities, which prevents statistical analyses with this data. Dufrene, M. & P. Legendre. 1997. Species assemblages and indicator species: the need for a flexible asymmetrical approach. Ecological Monographs 67:345-366.


