Download
1 / 9
90 likes | 111 Views
This study focuses on the impact of contaminants on injectivity in fractured injection wells, analyzing fracture growth and containment in soft sand formations. It includes a comparison of sand face pressures versus injection rates in various regions and emphasizes best practices for injectors.

E N D
Fractured injection Fracture pressure assuming 0.7 psi/ft 0.6 psi/ft Sand face pressure (bar) Matrix injection Sand face pressure vs. rate (NAM)
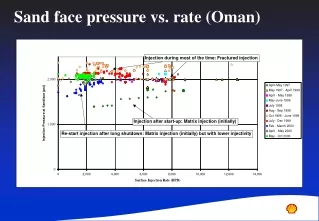
Coupled frac/reservoir 3 wells have the same injection pressures Field 2 wells with high injection rates 1 well with low injection rate Injection pressure history match (Oman)
Shell’s interests • Comprehensive analysis of sponsor field data plus proper reporting of this • Water injection fracture monitoring (fall-off;HIT;..) • Best practices for injectors in soft formations (completion, operation) • Impact of contaminants on injectivity for fracced injection (‘beyond PEA-23 relationship’) • Fracture growth / containment at material property boundaries