Download
1 / 10
100 likes | 234 Views
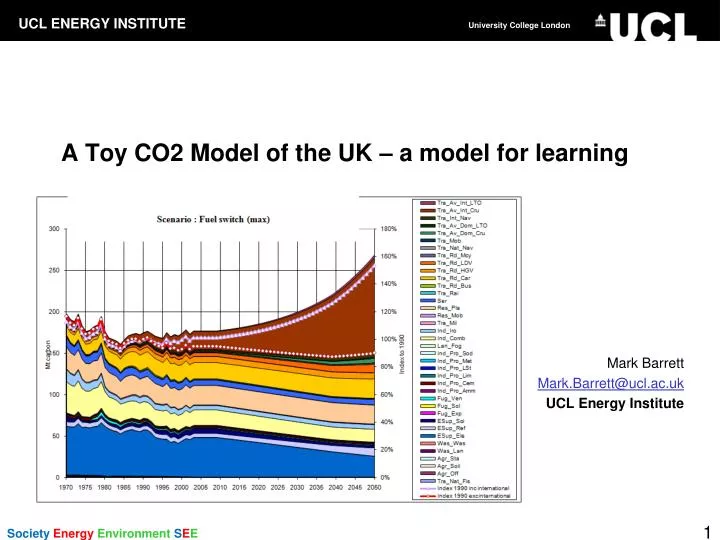
A Toy CO2 Model of the UK – a model for learning. Mark Barrett Mark.Barrett@ucl.ac.uk UCL Energy Institute. Description. This is a toy energy and CO2 model for the UK designed for teaching some basics about future scenarios for the emission of the greenhouse gas, CO2 .

E N D
A Toy CO2 Model of the UK – a model for learning Mark Barrett Mark.Barrett@ucl.ac.uk UCL Energy Institute
Description This is a toy energy and CO2 model for the UK designed for teaching some basics about future scenarios for the emission of the greenhouse gas, CO2 . The model may be downloaded here: http://www.bartlett.ucl.ac.uk/markbarrett/Energy/EneToy/EneCO2ToyModelUK.xls More complex models, such as SEEScen (scenario) model and EleServe (electricity services) represent energy systems with greater realism . The toy model does not accurately account for sectoral interactions such as the impact of CHP on other electricity supply requirements. The toy model is a simple 'what if' model to illustrate how future scenarios for the emission of one greenhouse gas, CO2, might be affected by different assumptions . Its aims are: • Enable people to get a feel for which are the important sectors. • Underline how growth rates, e.g. in aviation, can overwhelm technical reductions in the longer term • See the effect of assumptions about measures to control CO2 in terms of amount and speed of reduction • Understand how behavioural/lifestyle changes may be necessary to reach target reductions • Illustrate the importance of international emissions from aircraft and ships • Show the shift from historical trends required to reach different reductions
CO2 Emission components – demand sectors The model is disaggregated according to DEFRA (now DECC) data at: http://www.decc.gov.uk/en/content/cms/statistics/climate_change/gg_emissions/uk_emissions/2008_final/2008_final.aspx ResidentialHousehold and gardening (mobile) Residential plant Services Commercial and institutional IndustryAmmonia production Cement production Lime production Limestone and dolomite use Metal production Soda ash production and use Other industrial fuel combustion Iron and steel Transport Civil aviation (Domestic, Cruise) Civil aviation (Domestic, Landing and take off) International bunkers - Aviation (Cruise) International bunkers - Aviation (Landing and take off) International bunkers - Navigation National navigation National fishing Military aircraft and shipping Railways Buses Passenger cars HGVs Light duty vehicles Mopeds & motorcycles Other mobile sources and machinery Off-road vehicles and other machinery Stationary
CO2 Emission components – supply sectors Supply Petroleum refining Manufacture of solid fuels and other energy industries Exploration production, transport Solid fuel transformation Venting and flaring Misc Landfill Waste incineration Forest and grassland conversion Direct Soil Emission
Assumptions For each component of emission, the model applies user supplied assumptions about basic growth in activity; and emission reduction measures – behavioural, demand management, efficiency and fuel switching – each of which has maximum reduction and rates of introduction which gives an emission index for each growth and measure. Growth %/a Index 2050 Behavioural Measure Reduction (max) Yrs to 100% penetration Index 2050 Behavioural Measure Reduction (max) Yrs to 100% penetration Index 2050 Demand management Measure Reduction (max) Yrs to 100% penetration Index 2050 Efficiency Measure Reduction (max) Yrs to 100% penetration Index 2050 Fuel switch Measure Reduction (max) Yrs to 100% penetration Index 2050
Model For each component of emission, the model applies a basic growth in activity; and emission reduction measures – behavioural, demand management, efficiency and fuel switching – each of which has maximum reduction and rates of introduction which gives an emission index for each growth and measure. A scenario comprises different assumptions about the growth and measures. The model simply calculates the total emission change by multiplying the indices arising from the assumptions. The model outputs CO2 emissions for surface activities and CO2 equivalent emissions for aircraft. Emissions are output annually to indicate whether targets for particular years might be met. Emission integrated over the future period to 2050 are output. Climate change and its impacts are determined by the integrated effect of greenhouse gases over a period.
Toy CO2 model output - annual emissions Notice which sectors dominate, and how the rate of emissions reductions depends on how fast measures are introduced, and how when fully implemented, emissions may grow again because of increases in social and economic activity.
Toy CO2 model output – cumulative emissions Global warming is a result of atmospheric GHG concentrations changing the net radiation exchange power P (W/m2) of the world, operating over a period of time, t. Total change in world’s energy is: E = P.t Given that CO2 remains in the atmosphere for 1-200 years, the total global warming is more or less determined by the total emissions over the period to 2050 and beyond. Furthermore, there is concern that positive feedbacks will lead to further warming (e.g. through methane release and snow melt) These considerations means early emission reductions are of great importance.
Questions What effect does including international aviation and shipping emissions have on UK emissions? What does the model tell us about reducing UK GHG emissions? What are the differences between past and future trends? How important are early fast measures? What about greenhouse gas emissions other than CO2? Where is the model weakest? How would you improve the model? Would your improvements remove all significant limitations of the toy model; if not which remain? What use are such models? What do you learn from such models? Historical data to 2008 rather than 2004 are available here: http://www.decc.gov.uk/en/content/cms/statistics/climate_change/gg_emissions/uk_emissions/2008_final/2008_final.aspx What impact would using these have on projections? Would it make meeting near targets (e.g. For 2020) easier of harder? Currently the UK has a target of 80% reduction over the period 1990-2050 ; is this likely to hold or should the reduction be larger? If so, why?
References: Barrett GENERAL: http://www.bartlett.ucl.ac.uk/markbarrett/Index.htmlhttp://www.bartlett.ucl.ac.uk/markbarrett/Teaching/Educ.html • CONSUMPTION: Report on consumption, energy and carbon dioxide including behavioural measures. • http://www.bartlett.ucl.ac.uk/markbarrett/Consumption/EneCarbCons05.zip • TRANSPORT • Consultancy to DfT on project. Carbon Pathways: Analysis Informing Development of a Carbon Reduction Strategy for the Transport Sector, July 2008 .http://www.dft.gov.uk/pgr/sustainable/analysis.pdf • Overview of some aspects of sustainable transport : http://www.bartlett.ucl.ac.uk/markbarrett/Transport/TransportSus_MBarrett_020608.ppt • Summary presentation of some Auto-Oil work on transport and air quality, including some non-technical measures: http://www.bartlett.ucl.ac.uk/markbarrett/Transport/Land/AutoOil/JCAPWork.ppt • Aviation: • Technical scenarios http://www.bartlett.ucl.ac.uk/markbarrett/Transport/Air/Aviation94.zip • Effects of charges: http://www.bartlett.ucl.ac.uk/markbarrett/Transport/Air/AvCharge.zip • ELECTRICITY: Feasibility of a high renewable electricity system • Barrett, M. 2007, A Renewable Electricity System for the UK. In Renewable Energy and the Grid: The Challenge of Variability, Boyle, G., London: Earthscan. ISBN-13: 978-1-84407-418-1 (hardback). • http://www.cbes.ucl.ac.uk/projects/energyreview/Bartlett%20Response%20to%20Energy%20Review%20-%20electricity.pdf • http://www.bartlett.ucl.ac.uk/markbarrett/Energy/UKEnergy/UKElectricityGreenLight_100506.ppt • SCENARIOS • Barrett M, December 2007, Low Emission Energy Scenarios for the European Union, report 5785. ISBN 91-620-5785-5, ISSN 0282-7298. http://www.naturvardsverket.se/Documents/bokhandeln/620-5785-5.htm • Naturvårdsverket (Swedish environmental protection agency, SE-106 48 Stockholm www.naturvardsverket.se DynamicPhysical Energy Model (1981) www.bartlett.ucl.ac.uk/web/ben/ede/BENVGEED/ERG 044.pdf www.bartlett.ucl.ac.uk/web/ben/ede/BENVGEED/ERG045_complete.pdf • HEALTH • Barrett M, Holland M, April 2008, The Costs and Health Benefits of Reducing Emissions from Power Stations in Europe. Published by the Air Pollution and Climate Secretariat and the European Environmental Bureau. ISBN: 978-91-975883-2-4 • ISSN: 1400-4909. http://www.airclim.org/reports/APC20_final.pdf