Download
1 / 43
430 likes | 518 Views
Fish Assemblage Metrics: Key Focal Species Physical Habitat Metrics Based On Life History Stage Associations and Population Dynamics; Responses of Native and Invasive Species Populations. ???. Sean Hayes, Director of Fisheries Ecosystem Research Unit, NMFS

E N D
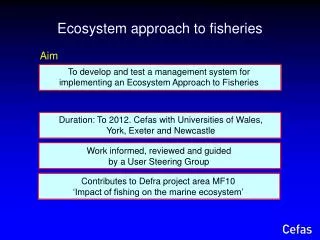
Fish Assemblage Metrics: Key Focal Species Physical Habitat Metrics Based On Life History Stage Associations and Population Dynamics; Responses of Native and Invasive Species Populations ??? Sean Hayes, Director of Fisheries Ecosystem Research Unit, NMFS Southwest Fisheries Science Center Salmon Ocean Ecology Team Leader (enabler?)
This one time………. in Scott Creek… John clarified… “So we hope ….we can develop metrics based on specific life history associations with physical habitat conditions, and develop a rating system of alternatives based on understanding how these specific life history associations with physical habitat conditions would play into the dynamics of population growth and recovery”
2 adults return to spawn To make more fish here? 4,000 eggs are laid Can we fix something here? Ocean? 800 fry hatch Freshwater? 10 reach adulthood 200 smolts go to sea How do we DO and MEASURE that?
Metrics • Growth • Food • Survivorship in the new habitat - Water quality, predators…. • migration behavior/timing/recruitment in/out of the new habitat • subsequent measures of marine survival GOAL- try to change certain perspectives
Benefits of Wetland rearing • Case studies • Yolo Bypass- Sacramento • Scott Creek
Knaggs Ranch Agricultural Floodplain Pilot Project Results 2011-2012 UCD, DWR, NMFS, Cal Trout USBR and others..
Pilot Project 5-acres
The Knaggs Ranch Pilot Project: Testing Chinook growth on an experimental agricultural flood plain Fish planted 1/31/12 Average Length and Weight 48 mm 1.09 grams
After 5-6 months rearing in estuary Steelhead in Scott Creek Typical spring downstream migrant (smolt?) ~20% of “smolts” use it- but comprise 85% of returning adults 100mm
Food • Scott Creek Estuary- benthic crustaceans Corophium and Eogammarussp • Yolo Bypass- seed banks of midge cocoons (Hydrobaenussaetheri)- (Benignoand Sommer 2009) • Mokelumne River- Large Pulse flood events from reservoirs produce zooplankton communities including lipid rich Daphnia (Kern et al in prep)
R.B. MacFarlane A.P. Klimley S.L. Lindley A.J. Ammann P.T. Sandstrom C.J. Michel E.D. Chapman Migration & Survival of Juvenile Salmonids in California’s Central Valley & San Francisco Estuary
Coleman Hatchery Red Bluff Diversion Dam Thomes Creek Confluence GCID Ord Bend Butte City Bridge X 1000= Survival Colusa Bridge Sacramento Confluence with Delta Cross Channel Rio Vista Bridge Benicia Bridge Chipp’s Island Golden Gate Bridge
Fall Run acoustic tracking 2012 spring 2012 Pilot Effort Tagging goals • Fall run- CNFH • 140 x 2 early/late Apr
The Predator Issue….. Just how bad is it? Loboschefsky, E., Benigno, G., Sommer, T., Rose, K., Ginn, T., Massoudieh, A., and Loge, F. 2012. Individual-level and Population-level Historical Prey Demand of San Francisco Estuary Striped Bass Using a Bioenergetics Model. San Francisco Estuary and Watershed Science 10(1). • Sacramento Bay/Delta populations of striped bass consume…. ~25,000,000 KG of fish per year 5% survival …of 12 million fish (600,000 left….) the single largest Chinook release in CA 10,000,000 fish * 5g= 50,000 kg 50,000kg/25,000,000= ….0.2% of striped bass annual metabolic requirements
The envelope continued • CA hatcheries release 50million fish (some years)… • Mostly sub-yearling, some yearlings… ave 10g fish? 10g *50,000,000= 500,000kg hatchery salmonids 500,000/25,000,000 kg= 2% “Striped Bass are not a problem for salmon…. they rarely appear in their diet…” Striped bass can eat every single juvenile salmon in the Sacramento/San Joaquin basin and they still wont be a significant part of striped bass diet…
Salmon Life cycle ~0.8% ‘return’ Escapement+ Harvest= ~105,000 4,000 eggs are laid CNFH Fall Run 12,000,000 fry The salmon life cycle Marine survival 15-20%!!! The Point? Fish Die… Get over it 800 fry hatch 10 reach adulthood ???? 95%mortality- ~600,000 smolt enter the ocean Image courtesy of S. Lindley
1230 steelhead/month Scott Creek Predation-how much can a few birds really eat? 11.3 g at 4.16 kJ/g 47 kJ/steelhead 41 steelhead/day 1939 kJ/day
Lagoon Recruitment 3 Months x 2 Mergansers = 6000 Juveniles! 2007 2008 2009
Summer Lagoon Population Dynamics 2007 2008 2009
Back-calculating consumption • Excretion • Consumption Recapture 0.84% N= 35,000 Point Reyes Bird Observatory
Back-calculating consumption • Consumption ~ 30-50% ~ 27% of juvenile salmonids consumed by Western gulls In the last 100 feet of stream!
Metrics Fish die… get over it! • Growth • Food • Survivorship in the new habitat - Water quality, predators…. • migration behavior/timing/recruitment in/out of the new habitat • Entrainment/Entrapment? • Subsequent measures of marine survival
Conclusions • Multiple metrics can be measured • Fairly straight forward • Lots of know-how in RR basin • Logistics cheaper/easier than Sacramento • Don’t be afraid of predator issues • trade off of mortality for growth can lead to increased marine survival • Given the loss of wetland habitat… • You can probably only improve
Upper river Lower river Estuary Delta Only 7% make it to the ocean! Late Fall Chinook Cumulative Downstream migration and survival 2007-2009 100 80 % Cumulative Survival 60 40 20 0 1 5 10 Reach
Points to include • Metrics • Benefits of floodplain/estuarine/wetland rearing • Examples of predation • Scott creek • Central valley- coleman vs striped bass • Final metric must be marine returns
Cosumnes River • Rapid Growth Natural habitat & Rapid Growth Photos: C. Jeffres
What ? Predators? (Frechette and Osterback) 460 Kcal/day= 50-100 coho parr
River growth vs. floodplain growth Jeffres et al 2008
Floodplain fatties! Fish released Average Length and Weight 3/12/12 76.2 mm 5.27 grams
Size threshold for ocean survival 80% of returning adults use estuary pathway Ocean upper watershed estuary/lagoon Growth patterns from egg to smolt