Download
1 / 15
150 likes | 307 Views
This study explores cosmic ray observations from Voyager 1 and 2 as they travel through the heliosheath. The research covers the response of galactic cosmic rays (GCRs) during solar maximum and minimum periods, specifically during cycle 23 and the onset of cycle 24. Notable findings include long-lasting intensity increases at both Voyager spacecraft, variations in time histories, and significant changes in cosmic ray responses as Voyager 2 approaches the termination shock. This work provides insights into the dynamics of cosmic rays and their interaction with the heliosphere.

E N D
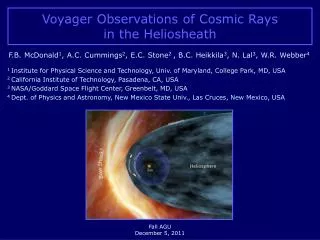
Voyager Observations of Cosmic Rays in the Heliosheath F.B. McDonald1, A.C. Cummings2, E.C. Stone2 , B.C. Heikkila3, N. Lal3, W.R. Webber4 1 Institute for Physical Science and Technology, Univ. of Maryland, College Park, MD, USA 2 California Institute of Technology, Pasadena, CA, USA 3 NASA/Goddard Space Flight Center, Greenbelt, MD, USA 4 Dept. of Physics and Astronomy, New Mexico State Univ., Las Cruces, New Mexico, USA Fall AGU December 5, 2011
Voyager Cosmic Ray Telescopes Energetic Particle Coverage H: 1.8-300 MeV He: 1.8-650 MeV/n Z = 1-28 (Resolves Isotopes) E: 2.5 – 160 MeV ← 28.6 cm → • Outline • Introduction • Galactic Cosmic Rays in the Heliosheath. • Long-lasting Heliosheath Intensity Increases • Discussion
Introduction • Voyager heliosheath observations extend from solar max to solar min epochs of cycle 23 and well into the onset of cycle 24. • At 1 AU the cycle 23 solar minimum was the longest and deepest of the last ~ 100 years and cycle 24 so far has been weird in its own special way. • The combined Pioneer-Voyager-IMP-ACE solar min/solar max data indicate GCR 265 MeV/n He intensities did not change significantly at the location of the TS from 1997/1998 through 2003. However at V1 there was a rapid increase associated with the onset of recovery from the cycle 23 solar maximum. • V1 time history of GCRs in the heliosheath is relatively simple and dominated by 2 long-term exponential increases. At V2, these time histories are more complex. May reflect different phases of the solar cycle and the relative penetration depth into the heliosheath.
Introduction • Long lasting heliosheath intensity increases play a major role at V2. Similar increases were observed at both V1 and V2 as they approached the TS. • There is a marked change in the GCR response to these transients as V2 moves deeper into the heliosheath. Are there essentially simultaneous increases at V1 and V2? • Definitions: • Dynamic Gradient: GDYN • Intensity increase / unit time divided change in radial distance over this period • Intensity Gradient: 1/J • (dJ/dr) = gr
Arrows Mark Voyager-1 Events
Arrows define discontinuous changes in the 10 MeV electron intensity. Note that the rate of increase appears to be approximately the same in alternate regions. After Webber, 2012. Burlaga and Ness, 2010; Stone, et. al., 2011
Discussion • At V1 significant variability in all components from TSX to ~ 2008.25. Then relatively smooth, exponential increases in GCRs • Long lived TSP events previously noted as V1 (and V2) neared the TS. They appear to represent periods when the spacecraft is magnetically connected to the TS. • The 2 modest jumps in V1 electron intensity at 2009.7 and 2011.25 represent passage into a different magnet field regime. • The V2 long lasting, transient increases probably also reflect connections to a different regime of the heliosheath. • The C low energy J=AT slope is consistent with the concept advanced by Florinski and Pogorelov (2008) that the heliosheath is a long term storage region for GCRs < ~ 200 MeV/n. • The flat time history of V1 GCR He > 265 MeV/n and the decrease in V1 ACR and TSP intensities may suggest V1 is approaching the heliopause. • The End Is Near!!!