Download

1 / 72
740 likes | 962 Views
MedGen 505 Gene Regulation Bioinformatics Wyeth W. Wasserman. www.cisreg.ca. Overview. TFBS Prediction with Motif Models Improving Specificity of Predictions Analysis of Sets of Co-Expressed and Co-Regulated Genes.

E N D
MedGen 505 Gene Regulation Bioinformatics Wyeth W. Wasserman www.cisreg.ca
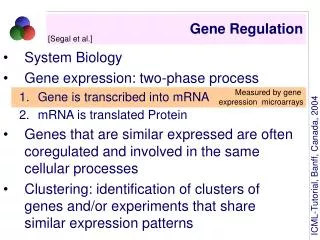
Overview • TFBS Prediction with Motif Models • Improving Specificity of Predictions • Analysis of Sets of Co-Expressed and Co-Regulated Genes
Transcription Factor Binding Sites(over-simplified for pedagogical purposes) URF Pol-II URE TATA
Laboratory Discovery of TFBS ACTIVITY LUCIFERASE LUCIFERASE LUCIFERASE LUCIFERASE LUCIFERASE LUCIFERASE LUCIFERASE
A matrix describing a a set of sites A 14 16 4 0 1 19 20 1 4 13 4 4 13 12 3 C 3 0 0 0 0 0 0 0 7 3 1 0 3 1 12 G 4 3 17 0 0 2 0 0 9 1 3 0 5 2 2 T 0 2 0 21 20 0 1 20 1 4 13 17 0 6 4 Representing Binding Sites for a TF Set of binding sites AAGTTAATGA CAGTTAATAA GAGTTAAACA CAGTTAATTA GAGTTAATAA CAGTTATTCA GAGTTAATAA CAGTTAATCA AGATTAAAGA AAGTTAACGA AGGTTAACGA ATGTTGATGA AAGTTAATGA AAGTTAACGA AAATTAATGA GAGTTAATGA AAGTTAATCA AAGTTGATGA AAATTAATGA ATGTTAATGA AAGTAAATGA AAGTTAATGA AAGTTAATGA AAATTAATGA AAGTTAATGA AAGTTAATGA AAGTTAATGA AAGTTAATGA • A single site • AAGTTAATGA • A set of sites represented as a consensus • VDRTWRWWSHD (IUPAC degenerate DNA)
TGCTG = 0.9 PFMs to PWMs Add the following features to the model: 1. Correcting for the base frequencies in DNA 2. Weighting for the confidence (depth) in the pattern 3. Convert to log-scale probability for easy arithmetic wmatrix fmatrix A 1.6 -1.7 -0.2 -1.7 -1.7 C -1.7 0.5 0.5 1.3 -1.7 G -1.7 1.0 -0.2 -1.7 1.3 T -1.7 -1.7 -0.2 -0.2 -0.2 A 5 0 1 0 0 C 0 2 2 4 0 G 0 3 1 0 4 T 0 0 1 1 1 f(b,i)+ s(n) Log() p(b)
Performance of Profiles • 95% of predicted sites bound in vitro (Tronche 1997) • MyoD binding sites predicted about once every 600 bp (Fickett 1995) • The Futility Conjuncture • Nearly 100% of predicted transcription factor binding sites have no function in vivo
JASPAR AN OPEN-ACCESS DATABASE OF TF BINDING PROFILES
PROBLEM: Too many spurious predictions Actin, alpha cardiac
I.9 Terms • Specificity – The portion of predictions that are correct • Sensitivity – The portion of “positives” that are detected • The detection of TFBS is limited by terrible specificity. Why?
Method#1Phylogenetic Footprinting 70,000,000 years of evolution reveals most regulatory regions
Phylogenetic Footprinting FoxC2 100% 80% 60% 40% 20% 0%
Phylogenetic Footprinting to Identify Functional Segments % Identity 200 bp Window Start Position (human sequence) Actin gene compared between human and mouse with DPB.
Human Mouse Phylogenetic Footprinting Dramatically Reduces Spurious Hits Actin, alpha cardiac
Performance: Human vs. Mouse • Testing set: 40 experimentally defined sites in 15 well studied genes (Replicated with 100+ site set) • 75-90% of defined sites detected with conservation filter, while only 11-16% of total predictions retained SELECTIVITY SENSITIVITY
ConSite (www.cisreg.ca) NEW: Ortholog Sequence Retrieval Service
Emerging Issues • Multiple sequence comparisons • Incorporate phylogenetic trees • Visualization • Analysis of closely related species • Phylogenetic shadowing • Genome rearrangements • Inversion compatible alignment algorithm • Higher order models of TFBS
I.18 OnLine Resources for Phylogenetic Footprinting • Linked to TFBS • ConSite • rVISTA • Alignments • Blastz • Lagan • Avid • ORCA • Visualization • Sockeye • Vista Browser • PipMaker
Method#2Discrimination of Regulatory Modules TFs do NOT act in isolation
Diverse and non-uniform use of terms: Partial glossary for tutorial Promoter Region • Promoter – Sufficient to support the initiation of transcription; orientation dependent; includes TSS • Regulatory Regions • Proximal – adjacent to promoter • Distal – some distance away from promoter (vague) • May be positive (enhancing) or negative (repressing) • TSS – transcription start site • TFBS – single transcription factor binding site • Modules – Sets of TFBS that function together Distal Regulatory Region Proximal Regulatory Region Distal R.R. EXON EXON TFBS TFBS TFBS TFBS TFBS TATA TFBS TFBS TSS
Detecting Clusters of TF Binding Sites • Trained Methods • Sufficient examples of real clusters to establish weights on the relative importance of each TF • Statistical Over-Representation of Combinations • Binding profiles available for a set of biologically motivated TFs
Training for the detection of liver cis-regulatory modules (CRMs)
Models for Liver TFs… HNF3 HNF1 HNF4 C/EBP
Logistic Regression Analysis * a1 * a2 * a3 * a4 Optimize a vector to maximize the distance between output values for positive and negative training data. Output value is: elogit p(x)= 1 + elogit S “logit”
Performance of the Liver Model • Performance • Sensitivity: 60% of known CRMs detected • Specificity: 1 prediction/35,000bp • Limitations • Applies to genes expressed late in hepatocyte differentiation • Requires 10-15 genes in positive training set • This model doesn’t account for multiple sites for the same TF • New methods from several groups address this limit
UGT1A1 Wildtype Other Liver Module Model Score “Window” Position in Sequence
Making better predictions • Profiles make far too many false predictions to have predictive value in isolation • Phylogenetic footprinting eliminates ~90% of false predictions • Algorithms for detection of clusters of binding sites perform better, especially when possible to create train on known examples for the target context
Method#3 Higher Order Models Position-position dependence
T C G A First-order: A A m:th-order: The chance of drawing base x is dependant on the identity of the previous m bases Probabilistic Methods for Pattern Discovery(7) What is a higher-order background model? p(A)=0.29, p(C)=0.21, p(G)=0.21, p(T)=0.29 Zero-order:
Linking co-expressed genes to candidate transcription factors
Automated sequence retrieval from EnsEMBL Set of co-expressed genes PhylogeneticFootprinting ORCA Putative mediating transcription factors Statistical significance of binding sites Detection of transcription factor binding sites oPOSSUM Procedure
Statistical Methods for Identifying Over-represented TFBS • Z scores • Based on the number of occurrences of the TFBS relative to background • Normalized for sequence length • Simple binomial distribution model • Fisher exact probability scores • Based on the number of genes containing the TFBS relative to background • Hypergeometric probability distribution
The oPOSSUM Database • Orthologous genes: 8468 • Promoter pairs: 6911 • Promoters with TFBS: 6758 • Total # of TFBS predictions: 1638293 • Overall failure rate: 20.2%
Validation using Reference Gene Sets TFs with experimentally-verified sites in the reference sets.
Application to Microarray Data Sets • NF-кB inhibition microarray study
C-Myc SAGE Data • c-Myc transcription factor dimerizes with the Max protein • Key regulator of cell proliferation, differentiation and apoptosis • Menssen and Hermeking identified 216 different SAGE tags corresponding to unique mRNAs that were induced after adenoviral expression of c-Myc in HUVEC cells • They then went on to confirm the induction of 53 genes using microarray analysis and RT-PCR
C-Fos Microarray Experiment • In a study examining the role of transcriptional repression in oncogenesis, Ordway et al. compared the gene expression profiles of fibroblasts transformed by c-fos to the parental 208F rat fibroblast cell line • We mapped the list of 252 induced Affymetrix Rat Genome U34A GeneChip sequences to 136 human orthologs
http://www.cisreg.ca/cgi-bin/oPOSSUM/opossum INPUT A LIST OF CO-EXPRESSED GENES
SELECT: • CONSERVATION • PSSM MATCH THRESHOLD • PROMOTER REGION • STATISTICAL MEASURE
de novo Pattern Discovery • Exhaustive • e.g. YMF (Sinha & Tompa) • Generalization: Identify over-represented oligomers in comparison of “+” and “-” (or complete) promoter collections • Monte Carlo/Gibbs Sampling • e.g. AnnSpec (Workman & Stormo) • Generalization: Identify strong patterns in “+” promoter collection vs. background model of expected sequence characteristics