Download
1 / 30
300 likes | 450 Views
Assessment of Wind Borne Debris Criteria for the Florida Panhandle. February 2006 ARA Progress Report. Scientific Approach--Use Engineering Models to Quantify Risks, Costs and Benefits.

E N D
Assessment of Wind Borne Debris Criteria for the Florida Panhandle February 2006 ARA Progress Report
Scientific Approach--Use Engineering Models to Quantify Risks, Costs and Benefits Objective--Perform a engineering-based risk assessment of the hurricane wind borne protection options for the Florida Panhandle. Approach 1. Use ARA’s end to end hurricane and building performance models, updated with recent data. 2. Perform simulations of hurricanes striking the Panhandle, using updated ASCE-7 hurricane models. 3. Use detailed models of 8 residential buildings located at many sites in the Panhandle 4. Assess building damage and loss with and without opening protection for wind-borne debris 5. Aggregate output metrics for direct comparisons of benefits and costs
Overview of Approach SelectLocationsand Buildings HurricaneHazardSimulations Building Models· WBD Protection · No WBD Protection Physical Damage· WBD Protection · No WBD Protection Losses· WBD Protection · No WBD Protection Benefits· Avoided Losses - Building - Contents - Loss of Use - Costs· FBC Baseline • Additional Costs of WBD Protection Model Output Metric· Risks · Benefits · Costs · By Location & Building
Project Tasks Wind Tunnel Tests.Perform wind tunnel tests for houses located in treed environments characteristic of the Florida Panhandle. Develop velocity profiles, turbulence intensity and pressure load models for houses in treed environments. Model Representative Houses.Select representative Panhandle houses and develop computer models for analysis of wind borne debris protection effects. Update/Validate Wind Borne Debris Model.Update ARA’s wind borne debris model to reflect new load models and impact resistance data. Perform validation comparisons on window/building performance with available field data on recent Florida Hurricanes.
Project Tasks (cont’d) Simulate House Performance.Perform hurricane simulations of the representative houses located at various positions in the Panhandle. Evaluate building damage and loss with and without windborne debris protection. Quantify Risks, Benefits, and Costs of Wind Borne Debris Protection.For each house in each Panhandle location, develop the detailed loss reduction data, costs, and risks.Summarize the results and present findings.
Task 1. Wind Tunnel Tests Wind tunnel tests have been completed. Data is being analyzed for modeling the mean wind speeds, gusts, and pressures on houses within treed environments. The wind tunnel tests simulated medium and light density forests surrounding houses in subdivisions. The trees simulate 50 and 75 foot tree heights. The velocity profiles compare very well with published profiles from full scale measurements in forests. The results show a significant reduction in windspeeds beneath the trees. The final impact won’t be known until we begin simulating effects on houses.
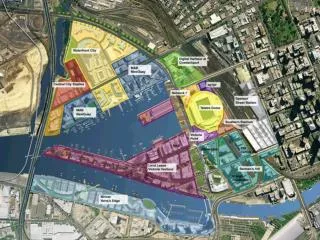
Beach Town Suburban Forests BarrierIsland Suburban Bay Ocean Z Displacement Height X Open to SuburbanTransition Residential –Heavily Treed Open Terrain Modeling Boundary layer transition will be affected by tall trees and influence windspeeds, loads, and WBD environment on one and two story residences
Mean Velocity Profiles-Preliminary • Mean wind speed with height • Closely agrees with full-scale data • Medium and light density forest • Suburban (exposure B) • Open (exposure C)
Turbulence Intensity vs Height • Fluctuations with height • Closely agrees with full-scale data • Medium and light density forest • Suburban (exposure B) • Open (exposure C)
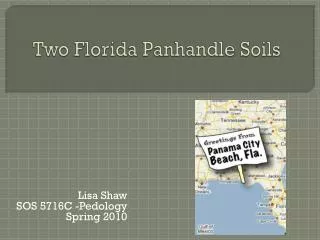
Task 2. Model Representative Houses • Panhandle site visit completed • CAD modeling of houses is underway • 8 Houses will be modeled and positioned at multiple locations in Panhandle
Task 3, 4, and 5 Status • Wind-borne debris model is being updated • Updated validation will begin in mid-February • Simulation of Panhandle homes will begin in early March (different locations and tree env.) • Goal is to have preliminary results by late March and final report in May • Results will include metrics on risk, costs, loss reduction benefits, and damage frequency with and without opening protection for model houses at various locations in the Panhandle
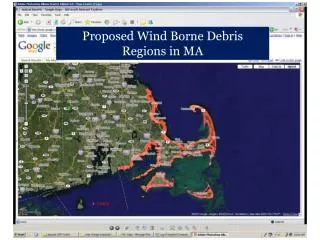
Wind-Borne Debris Construction Options • Current requirements • FBC WBD Limited to 1 Mile from Coast • Alternative WBD Code Options • Evaluate WBD region by identifying border where cost = benefits • Evaluate Acceptable Protection Options • Panel Shutters • Accordion Shutters • Impact Resistant Glazing • Plywood Shutters
Benefits (Loss Reduction) Loss Reduction Differential (Compared to FBC w/o WBD Protection) Avoided Losses = Benefits Building Repair and Reconstruction Contents Loss of Use Other Benefits Depends on Building, Location, Terrain Cost of WBD Protection Increases Initial Costs Range of Protection Options Permanent In Place Systems that Close Removable Shutters Different Materials Depends on Building and Location Benefits Costs Present Findings--Do Benefits Outweigh Costs? Metrics • Physical Damage • Average Annual Losses Aggregate Costs • Benefit Cost Ratio Aggregate Loss Reduction • Net Present Value Building Life (years)
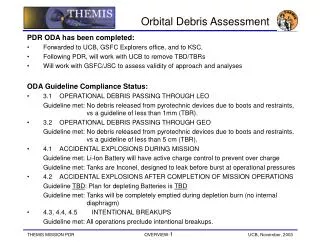
Model Validation with Measured Data • Florida Coastal Monitoring Program (UF, DCA) • Provides real measured pressure loads on houses during hurricanes • Provides a benchmark pressure and wind speed value for roof cover loss (roof cover provides a major source of debris)
House Data from Ivan 96-107 mph
Incident Wind Direction 110º Analysis of Wind Pressure on Houses Panhandle house in Isidore ’02 and Ivan ‘04 • Wind tunnel pressure • contours to be compared • with full scale data
Model Validation with Measured Data Sample analysis from measurements on a house during Hurricane Ivan
Window Protection Testing • Lexan window cover tested at • 35 mph (code required) • 45 mph • 56 mph • 69 mph
Model Validation with Observed Damage • Statistical analysis of damage documented on hundreds of homes after the 2004 season • Data will be used as a benchmark for ARA model performance. • Does the model match observation?
Task 3, 4, and 5 Status • Wind-borne debris model is being updated • Updated validation will begin in mid-February • Simulation of Panhandle homes will begin in early March (different locations and tree env.) • Goal is to have preliminary results by late March and final report in May • Results will include metrics on risk, costs, loss reduction benefits, and damage frequency with and without opening protection for model houses at various locations in the Panhandle