Download
1 / 86
930 likes | 1.64k Views
Fluids and Nutrition in the ICU. Dr Paul Healey John Hunter Hospital, Newcastle August 2013. Bigger than Ben Hur !!. Outline. Fluids and electrolytes Basic physiology Assessment of fluid status and fluid responsiveness Fluids - Crystalloids and Colloids Fluids - Costs

E N D
Fluids and Nutrition in the ICU Dr Paul Healey John Hunter Hospital, Newcastle August 2013
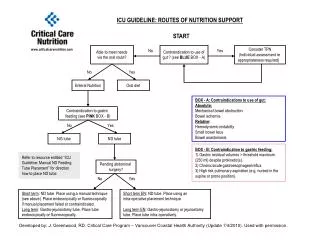
Outline • Fluids and electrolytes • Basic physiology • Assessment of fluid status and fluid responsiveness • Fluids - Crystalloids and Colloids • Fluids - Costs • Evidence to guide fluid delivery • Case studies • Nutrition • Why is nutrition important in ICU patients • Enteral nutrition • Parenteral nutrition • Evidence for nutritional choices • Feed intolerance • Diarrhoea • The refeeding syndrome
Why fluid therapy • 2nd most common medical therapy • Often prescribed by the most junior member of medical team • There is often confusion as to what end points to aim for with fluid therapy • BP • HR • UO • CVP • Derived numbers such as SVV, VTI, PPV • Fluid prescription is mostly dependent upon your postcode.
Historical perspective • 1832 – Cholera patient in Scotland who was critically ill and dehydrated given saline based solution instead of blood letting which was standard of care for the time • 1876 – Development of Ringer’s solution by Sidney Ringer in London • 1876 – Modification of Ringer’s solution to include lactate by Dr Alex Hartmann in the US • 1940 – Use of albumin by US army in WWII • 1950 – Development of the plastic catheter by Mayo Clinic Anaesthesiology resident Dr David Massa, which allowed widespread use of IV fluid therapy, despite the lack of any evidence of its potential efficacy
Some basics • Water • Electrolytes
Pathophysiology • Traditional model – Starling model
Pathophysiology • Revised model in pathology of critical illness • Importance of the endothelial surface layer (glycocalyx) in transvascular exchange • When ESL in tact and in euvolemia – colloids may sustain plasma expansion better. • However in critical illness with inflammatory degradation of the ESL that causes increased vascular permeablity there is increased trans-capillary escape of albumin and other colloids, which may explain their diminished benefit • In the major trials comparing colloid to crystalloid the ratio of dose was 1: 1.2-1.4, not 1:3 as was predicted • The increased transcapillary leak will also allow excess crystalloid to accumulate in the interstitial spaces and contribute to reduced organ function
Phases of resuscitation • 1. Acute resuscitation • Goal is restoration of effective intravascular volume, organ perfusion and tissue oxygenation • Fluid accumulation and a positive fluid balance • 2. Maintenance • Goal is maintenance of the intravascular volume • Prevent unnecessary fluid loading and mitigate fluid accumulation • 3. Fluid removal • Goal is ‘active de-escalation’ with fluid removal • Secondary organ injury may result from failure to remove unnecessary volume
Case 1 • 75 year old female with septic shock likely secondary to urosepsis, retrieved from Belmont Hospital • Background • OA of knees • Ex-smoker 20 years ago • Management • CTKUB – NAD • 3.5 L of Normal saline • IV metaraminol at 20mL/hr • Current observations • HR - 120 • BP 65/35 • SaO2 96% on 4L via np • ABG – pH 7.15, PaCO2 31mmHg, PaO2 85mmHg, BE -7mmol.L, Lactate 4.5mmol.L • How can I tell if she needs more fluid ?? • If she does need more fluid – which one do I give, and how much ??
How to assess fluid status and fluid responsiveness • History • Illness history • Comorbidities • Treatment to now – fluid, vasopressors • Examination • Peripheral temperature • Vital signs (HR, BP, RR, capillary refill) • JVP, pulmonary oedema • Signs of end-organ hypoperfusion • Decreased LOC • Myocardial ischaemia • Decreased U/O • Investigations • Pathology (FBC, UEC, LFTs) • ABG – pH, BE, lactate • ScvO2 • Other tests • Static variables • CVP • PCWP • Echocardiography – IVC diameter and collapse, LVEDA • Dynamic variables • Passive leg raise • Systolic Pressure Variation/Pulse Pressure Variation – arterial pressure waveform • Stroke volume variation – PiCCO • Echocardiography – cardiac output measures • Clinical studies have suggested that only 50% of haemodynamically unstable critically ill patients are fluid responsive.
Goals of resuscitation • HR < 100 • Normal RR and gas exchange • MAP >65mmHg (may need to be higher in patients with a history of hypertension) • CVP 8-12 mmHg or 12-15 mmHg if intubated • Urine output : 0.5ml/kg/hr • Resolution of end-organ hypoperfuion : • Improving LOC • Lactate clearance of 10% • Lactate level < 2.0 mmol/L • ScvO2 >70% • Echocardiography • Filling state – IVC diameter and collapsability • Ventricular filling • Cardiac output
Case 1 • 75 year old female with septic shock likely secondary to urosepsis, retrieved from Belmont Hospital • Background • OA of knees • Ex-smoker 20 years ago • Management • CTKUB – NAD • 3.5 L of Normal saline • IV metaraminol at 20mL/hr • Current observations • HR - 120 • BP 65/35 • SaO2 96% on 4L via np • ABG – pH 7.15, PaCO2 31mmHg, PaO2 85mmHg, BE -7mmol.L, Lactate 4.5mmol.L • How can I tell if she needs more fluid ?? • If she does need more fluid – which one do I give, and how much ??
What fluid to give ?? The evidence
The SAFE-TRIPS study • Cross sectional study of 391 ICUs in 25 countries to describe the types of fluids administered during fluid resuscitation. • Data collected in 2007 and published in 2010. • Findings in a 24 hour period: • 37.1% of patients received resuscitation fluid • Main indicators for administering crystalloid or colloid were impaired perfusion (45%) or to correct abnormal vital signs (35%) • Overall • colloid given to more patients than crystalloids (23 vs 15%) and • Colloid given in more episodes than crystalloid (48 vs 33%) • The choice of fluid was most strongly related to location of the prescriber
Colloids • Albumin • Semi-synthetic colloids
Fluids - costs • Normal saline (1 L) • Hartman’s (1L) • Plasmalyte (1L) • Voluven (500mL) • Albumin 4% (100mL) • Albumin 20% (500mL) • Packed Red Cells (1 U) • $1.15 • $1.20 • $2.40 • $11.60 • $65 • $65 • $345
Colloids - Albumin • Albumin is a plasma protein with an average MW of 66kDa. In healthy humans it accounts for 80% of colloid oncotic pressure. • It has been available for human use since the 1940s. • Albumin is prepared by either cold ethanol (Cohn) fractionation or chromatographic purification of pooled donor plasma. • It is heat-treated at 60 C for 10 h and incubated at low pH to inactivate potentially transmissible viruses. • When infused in well hydrated individuals, • 4% albumin will expand the plasma volume by an amount equal to the volume infused, • 20% albumin will expand the plasma volume by approximately 4-5 times.
The SAFE trial (2004) • The Saline versus Albumin Fluid Evaluation Study • An international multi-cente RCT of 6997 patients comparing the use of albumin vs NS for fluid resuscitaton in ICU • Conclusions • No difference in 28 day mortality • Possible improved outcome with albumin in severe sepsis : unadjusted RR 0.87 (0.74-1.02), adjusted RR 0.71 (0.52-0.97) • Possible worse outcomes with albumin in TBI with an increased risk of mortality at 2 years : RR 1.88 (1.31-2.70) • ?? ALBIOS trial (20% albumin)
The CHEST trial • The Crystlalloid versus Hydroxyethyl Starch Trial (Myburgh et al 2012) • Involved 7000 general ICU patients who were randomized to masked fluid resuscitation with either HES 130/0.4 (Voluven)or normal saline while in the ICU
The 6S trial • Scandinavian Starch for Severe Sepsis/Septic Shock Trial • This trial randomised 804 patients in the ICU with severe sepsis to resuscitation with HES 130/0.42 (Tetraspan) vs. Ringer’s acetate
Case 1 • 75 year old female with septic shock likely secondary to urosepsis, retrieved from Belmont Hospital • Background • OA of knees • Ex-smoker 20 years ago • Management • CTKUB – NAD • 3.5 L of Normal saline • IV metaraminol at 20mL/hr • Current observations • HR - 120 • BP 65/35 • SaO2 96% on 4L via np • ABG – pH 7.15, PaCO2 31mmHg, PaO2 85mmHg, BE -7mmol.L, Lactate 4.5mmol.L • How can I tell if she needs more fluid ?? • If she does need more fluid – which one do I give, and how much ??
Other controversies • Fluid balance and mortality • Chloride and organ function • Sodium balance • Normal saline vs buffered crystalloid solutions • No fluids
Fluid balance • In experimental models of porcine septic shock, more vigorous fluid resuscitation was associated with greater hemodynamic stability, urine output, and preserved RBF; however, despite this apparent physiological benefit, high-volume resuscitation was associated with substantially increasedmortality • The majority of human data is post-hoc associative and not causative – however there appears to be a trend (See table) • Increased mortality • Worse respiratory function • Worse renal fuction • Increased LOS
Fluids : The Chloride problem • Fluid resuscitation with Normal saline causes hyperchloraemic metabolic acidosis • Shaw et al (2012) Retrospectively reviewed a large clinical database of major abdominal surgical patients treated only with NS vs only Plasmalyte (30,994 in 0.9% saline arm vs 926 in Plasma-Lytearm). They found after propensity matching, the 0.9% saline group had: • More fluid (1976 ml vs 1658 ml, p <0.001) • More buffer orders (6.3% vs 4.2%, p = 0.02) • Moretransfusions(11.5%vs1.8%,p<0.001) • Increased ventilator days (3.0 days vs 2.5 days, p <0.001) • A 5-fold greater chance of receiving dialysis (1% vs 4.8%, p <0.001) • But the balanced group had longer length of stay in the hospital (6.4 days vs 5.9, p < 0.001) • Yunos et al (2012) conducted a before after trial of 1533 patients in one Australian ICU. This involved comparison of a chloride liberal vs a chloride restrictive approach to IV fluid therapy.
Fluids : The Sodium problem • Recommended daily intake = 1 mmol/kg • Point prevalence study across 40 ICUS including 356 patients demonstrated the median total sodium administered was 225 mmol (IQR of 145-368 mmol) (Bihari et al 2012) • A recent small study of ICU patients (Bihari et al 2013) demonstrated that sodium balance can be independent of fluid balance. After 5 days of mechanical ventilation: • Cummulative fluid balance = -954mL • Estimated cummulative sodium balance = 258 mmol • Serum sodium increased from 140 to 147 mmol/L • Body weight decreased by -2.7 kg (SD 1.4 kg) • TBW decreased by – 3.4 L (SD 1.4 kg) • They postulated that sodium balance may correlate better with increased ECF volume and respiratory dysfunction • Therefore future studies may have to examine sodium balance and morbidity in critical care patients
Cochrane Review : Buffered vs non-buffered fluids • 14 trials with 706 patients • Included trials of perioperative resuscitation • Excluded trials of colloids, hypertonic fluids and dextrose based fluids • Outcomes • Clinical • Mortality – no statistical difference • Renal function – no statistical difference • Renal replacement therapy – no statistical difference • Post operative nausea and vomitting – no statistical difference • Blood loss – no statistical difference • Red cell and plasma transfusion – no statistical difference • Platelet transfusion – increased in non-buffered fluid group • Metabolic • pH – lower in buffered group by mean of 0.06 (0.04-0.08). This was not maintained on postoperative day 1 • PaCO2 – higher in buffered group post op (1.2mmHg) and day 1 (3.3mmHg) • Base excess – mean difference of 3.5 mmol/L postoperatively and 2.5mmol/l on day 1 • Serum sodium – higher post operatively in non-buffered by 2.7 mmol/L, no difference on day 1 post operatively • Serum chloride – higher post operatively in non buffered group 114 vs 107 mmol/l, and on day 1 postoperatively (116 vs 107 mmol/L)
Case 1 • 75 year old female with septic shock likely secondary to urosepsis, retrieved from Belmont Hospital • Background • OA of knees • Ex-smoker 20 years ago • Management • CTKUB – NAD • 3.5 L of Normal saline • IV metaraminol at 20mL/hr • Current observations • HR - 120 • BP 65/35 • SaO2 96% on 4L via np • ABG – pH 7.15, PaCO2 31mmHg, PaO2 85mmHg, BE -7mmol.L, Lactate 4.5mmol.L • How can I tell if she needs more fluid ?? • If she does need more fluid – which one do I give, and how much ??
The conclusions • Fluid is a drug, it should be given in appropriate doses, and its use reviewed regularly. In sicker patients its likely that the timing of the dosage is more important • There are 3 phases of resuscitation Resuscitation, Maintenance and Fluid removal – identify where your patient lies and act appropriately • Fluid status and fluid responsiveness is difficult to assess. No one single tool is infallible. • If unsure – fluid bolus 20mL/kg and reassess. But don’t keep giving if no change. • Normal saline is the safe answer • Colloids don’t offer any advantage over crystalloids. • Hopefully more directed research the controversies in the future