Download
1 / 11
110 likes | 334 Views
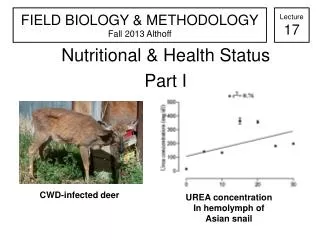
FIELD BIOLOGY & METHODOLOGY Fall 2013 Althoff. Lecture 17. Nutritional & Health Status Part I. UREA concentration In hemolymph of Asian snail. CWD-infected deer. Assessing Health and Nutritional Status or Dietary Quality of Fish and Wildlife Populations.

E N D
FIELD BIOLOGY & METHODOLOGYFall 2013 Althoff Lecture 17 Nutritional & Health Status Part I UREA concentration In hemolymph of Asian snail CWD-infected deer
Assessing Health and Nutritional Status or Dietary Quality of Fish and Wildlife Populations • Two basic approaches: 1) assess ____________________ --as in foods available to be consumed: plants, arthropods, vertebrates, etc.) 2) evaluate the ___________________ 1 2
Assessing quality of habitat/forage 1 • _______________ (to the target species)—a good thing • Can fairly easily collect samples year-round…but ___________________ to process • Challenge, though, is to identify what is actually __________…and in what ______________ • Bottomline: reasonable approach but _____ an approach often used for monitoring a local population
2 Assessing Directly • Can be ____________: a) if harvest animal b) or collect blood or tissue samples • Can be ____________: a) feces (droppings) b) urine (typically collected when snow cover present) • Can fairly easily collect samples year-round…can _____________________to process • Bottomline: ______ reasonable approach that is gaining acceptance for monitoring a local population
Nutritional Indices • ________________________ = the ability of an animal to cope with its present and future needs • Traditionally (~pre-1980s), nutritional status has frequently been assessed by measures of fat or energy stores in the body a) drawback #1: typically, cannot get this data unless the animal has ______ b) some fat/energy stores, like bone marrow are the ____ to be used…This means ___________ __________________________ __________________________
Characteristics of Good Indicesof Nutritional Status/Health Status 1 • Sensitive to _____________ in nutritional status • ________ in its indications (i.e., indicate protein, energy reserves, or mineral balance) • Allowance for collection of tissue or measures ____________ from live or dead animals by _________________ personnel • Relatively ____________________ of collection • ____________ and ______________ 2 3 4 5
Indicesof Nutritional Status/Health Status • Indices used vary by _________ within a class (i.e., might not use same index for carnivores herbivores, ruminants vs. non-ruminants) • Indices used vary by __________ (i.e., might not use same index for mammals as for birds or amphibians) • Most common indices are either a) index to __________ b) index (or actual) ___________________ of blood or urine
Biochemical Measures – Blood • Especially for blood samples, there like is likely impact of collection to the animal(s) that would affect the results—so must evaluate for each species • Samples collected relatively _________—and can know individual’s status (i.e, sex, age) • If _______________________, then objective and reproducible results should be realized • Major drawback—_____ to field and lab personnel processing blood
Biochemical Measures – Feces & Urine • Especially for fecal or urine samples, there like is almost no impact of collection to the animal(s) that would affect the results • Samples collected relatively _______—just might not know individual’s status (i.e, sex, age) unless collected during handling or close observation • If quality lab/lab process, then objective and reproducible results should be realized
Key Papers – Using Feces for obtaining Nitrogen content of diet • Leslie and Starkey 1985 Leslie, D.M.,Jr. and E.E. Starkey. 1985. Fecal indices to dietary quality of cervids in old growth forest. Journal of Wildlife Management 49:142-146. • Leslie et al. 2008 [handout]Leslie, D.M., Jr., R.T.Bowyer, and J.A. Jenks. 2008. Facts from feces: nitrogen still measures up as a nutritional index for mammalian herbivores. Journal of Wildlife Management 72:1420-1433
Percent nitrogen in feces and solid food of 6 juvenile elk Fed milk and solid food. Vertical bars denote standard error of the mean Cook, J.G., L.L. Irwin, L.D. Bryant, and J.W. Thomas. 1994. Fecal nitrogen and dietary quality relationships in juvenile elk. Journal of Wildlife Management 58(1):46-53.