Literature Review
10 likes | 233 Views
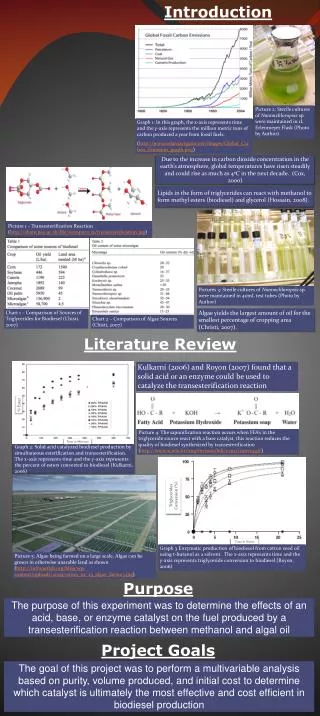
Introduction. Graph 1: In this graph, the x-axis represents time and the y-axis represents the million metric tons of carbon produced a year from fossil fuels . ( http:// www.solarnavigator.net/images/Global_Carbon_Emission_graph.png ).

Literature Review
E N D
Presentation Transcript
Introduction Graph 1: In this graph, the x-axis represents time and the y-axis represents the million metric tons of carbon produced a year from fossil fuels. (http://www.solarnavigator.net/images/Global_Carbon_Emission_graph.png) Picture 2: Sterile cultures of Nannochloropsissp. were maintained in 1L Erlenmeyer Flask (Photo by Author) Due to the increase in carbon dioxide concentration in the earth’s atmosphere, global temperatures have risen steadily and could rise as much as 4ºC in the next decade. (Cox, 2000) Picture 1 – Transesterification Reaction (http://share.psu.ac.th/file/waraporn.ra/transesterification.jpg) Lipids in the form of triglycerides can react with methanol to form methyl esters (biodiesel) and glycerol (Hossain, 2008). Pictures 3: Sterile cultures of Nannochloropsis sp. were maintained in 40mL test tubes (Photo by Author) Algae yields the largest amount of oil for the smallest percentage of cropping area (Christi, 2007). Chart 1 – Comparison of Sources of Triglycerides for Biodiesel (Chisti, 2007) Chart 2 – Comparison of Algae Sources (Chisti, 2007) Literature Review Kulkarni (2006) and Royon (2007) found that a solid acid or an enzyme could be used to catalyze the transesterification reaction % Ester • Graph 2: Solid acid catalyzed biodiesel production by simultaneous esterification and transesterification. The x-axis represents time and the y-axis represents the percent of esters converted to biodiesel (Kulkarni, 2006) Picture 4: The saponification reaction occurs when FFA’s in the triglyceride source react with a base catalyst, this reaction reduces the quality of biodiesel synthesized by transesterification (http://www.scielo.br/img/revistas/bdj/v13n2/2a07s3.gif) Time in Minutes Triglycerides Conversion (%) Purpose The purpose of this experiment was to determine the effects of an acid, base, or enzyme catalyst on the fuel produced by a transesterification reaction between methanol and algal oil Time in Hours • Graph 3 Enzymatic production of biodiesel from cotton seed oil using t-butanol as a solvent. The x-axis represents time and the y-axis represents triglyceride conversion to biodiesel (Royon, 2006) Picture 5: Algae being farmed on a large scale. Algae can be grown in otherwise unarable land as shown (http://infranetlab.org/blog/wp-content/uploads/2009/02/09_02_23_algae_farm03.jpg) Project Goals The goal of this project was to perform a multivariable analysis based on purity, volume produced, and initial cost to determine which catalyst is ultimately the most effective and cost efficient in biodiesel production