Download
1 / 42
420 likes | 506 Views
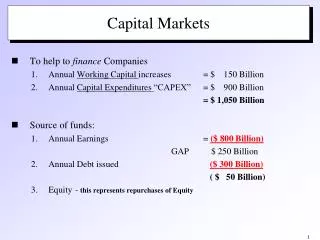
To help to finance Companies Annual Working Capital increases = $ 150 Billion Annual Capital Expenditures “CAPEX” = $ 900 Billion = $ 1,050 Billion Source of funds: Annual Earnings = ($ 800 Billion) GAP $ 250 Billion

E N D
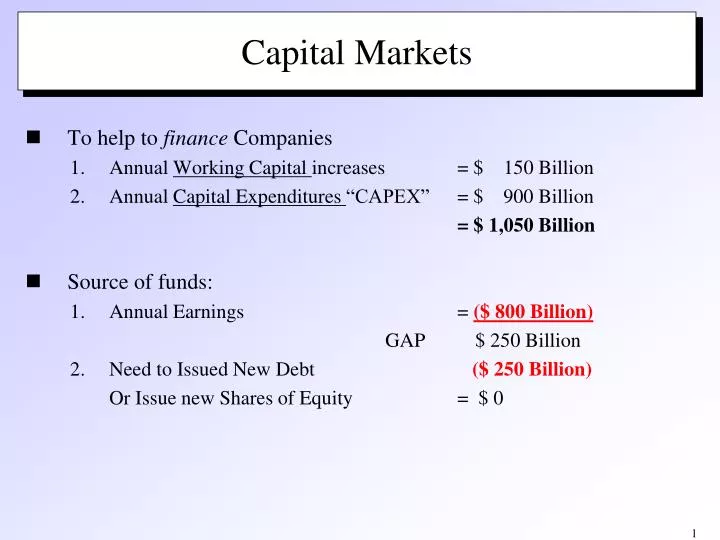
To help to finance Companies Annual Working Capital increases = $ 150 Billion Annual Capital Expenditures “CAPEX” = $ 900 Billion = $ 1,050 Billion Source of funds: Annual Earnings = ($ 800 Billion) GAP $ 250 Billion 2. Need to Issued New Debt ($ 250 Billion) Or Issue new Shares of Equity = $ 0 Capital Markets
Money Market Certificates of Deposit U.S. Treasury Bills Money Market Funds Bond Market U.S Treasury Notes and Bonds U.K. Gilts and Consols Municipal Bonds Corporate Bonds Equity Market Common Stock Preferred Stock Derivative Market Options Futures Other Swaps Pass-throughs Financial Instruments
From Stock Prices to Stock Returns • Stock Returns: take into account both price changes and dividend income • Over past 50 years, stock returns have ranged from: +48.28% in 1954 to -21.45% in 1974 • Stock returns over past 50 years have averaged around 11% • From 1998 through mid-’03, DJIA averaged 1.7%
DJIA annual Returns since 2003 Average 5.95% Standard Deviation 16.02%
Advantages of Stock Ownership • Provide opportunity for higher returns than bonds. • Over past 50 years, stocks averaged 11% and high-grade corporate bonds averaged 6%. • Good inflation hedge since returns typically exceed the rate of inflation. • Easy to buy and sell stocks. • Price and market information is easy to find in financial media. • Unit cost per share of stock is lower than for bonds.
Disadvantages of Stock Ownership • Stocks are subject to many different kinds of risk: • Business risk • Financial risk • Market risk • Event risk • Difficult to predict which stocks will go up in value due to wide swings in profits and general stock market performance • Low current income – Dividends - compared to other investment alternatives
Common Stock Values • Market Capitalization: the overall current value of the company in the stock market • Total number of shares outstanding multiplied by the market value per share • Investment Value: the amount that investors believe the stock should be trading for, or what they think it’s worth • Probably the most important measure for a stockholder
Types of Stock • Blue Chip Stocks: financially strong, high-quality stocks with long and stable records of earnings and dividends • Companies are leaders in their industries • Relatively lower risk due to financial stability of company • Popular with investing public looking for steady growth potential, perhaps dividend income • Provide shelter during unsettled markets • Examples: Wal-Mart, Proctor & Gamble, Microsoft, United Parcel Service, Pfizer and 3M Company
Types of Stock (cont’d) • Income Stocks: stocks with long and sustained records of paying higher-than average dividends • Dividends tend to increase over time (unlike interest payments on bonds) • Some companies pay high dividends because they offer limited growth potential • Examples: Verizon, Conagra Foods, Pitney Bowes, Wrigley
Types of Stock (cont’d) • Growth Stocks: stocks that experience high rates of growth in operations and earnings • High rate of growth in earnings > market • Higher price appreciation (due to increasing earnings) • Riskier investment because price will fall if earnings growth cannot be maintained • Typically pay little or no dividends • Examples: Lowe’s, Harley-Davidson, Starbucks, Apple
Types of Stock (cont’d) • Cyclical Stocks: stocks whose earnings and overall market performance are closely linked to the general state of the economy • Stock price tends to move with the business cycle • Tend to do well when economy is growing, poorly in slowing economy • Best for investors willing to move in and out of market as economy changes • Examples: Caterpillar, Maytag Corp.
Types of Stock (cont’d) • Defensive Stocks: stocks that tend to hold their value, and even do well, when the economy starts to falter • Stock price remains stable or increases when general economy is slowing • Products are staples that people use in good times and bad times, such as electricity, beverages, foods and drugs • Best for aggressive investors looking for “parking place” during slow economy • Examples: Proctor & Gamble, WD-40, Walmart
Market Capitalization • Small-Cap Stocks: under $1 billion • Mid-Cap Stocks: $1 billion to $4 or $5 billion • Large-Cap Stocks: more than $4 or $5 billion
Types of Stock • Small-Cap Stocks: small companies with market capitalizations less than $1 billion • Provide opportunity for above-average returns (or losses) • Short financial track record • Erratic earnings • Not widely-traded; liquidity is issue
Types of Stock (cont’d) • Mid-Cap Stocks: medium-sized companies with market capitalizations between $1 billion and $4 or $5 billion • Provide opportunity for greater capital appreciation than Large-Cap stocks, but less price volatility than Small-Cap stocks • Long-term track records for profits and stock valuation • “Baby Blues” offer same characteristics of Blue Chip stocks except size • Examples: Wendy’s, Barnes & Noble, Petsmart, Cheesecake Factory
Types of Stock (cont’d) • Large-Cap Stocks: large companies with market capitalizations over $4 or $5 billion • Number of companies is smaller, but account for 80% to 90% of the total market value of all U.S. equities • Bigger is not necessarily better • Tend to lag behind small-cap and mid-cap stocks, but typically have less volatility • Examples: AT&T, General Motors, Microsoft
Investing in Foreign Stocks • Globalization of financial markets is growing • U.S. equity market is less than 50% of world equity markets • Six countries make up 80% of world equity market • Until 1998, the U.S. market was one of best performing equity markets • Until 1998, much of performance of non-U.S. equities was due to changes in currency exchange rates
Stock Investment Strategies • Buy-and-Hold • Investors buy high-quality stocks and hold them for extended time periods • Goal may be current income and/or capital gains • Investors often add to existing stocks over time • Very conservative approach; value-oriented
Stock Investment Strategies (cont’d) • Current Income • Investors buy stocks that have high dividend yields • Safety of principal and stability of income are primary goals • May be preferable to bonds because dividends levels tend to increase over time • Often used to provide to supplement other income, such as in retirement
Stock Investment Strategies (cont’d) • Quality Long-Term Growth • Investors buy high-quality growth stocks, mid-cap stocks and tech stocks • Capital gains are primary goal • Higher level of risk due to emphasis on capital gains • Significant trading of stocks may occur over time • Diversification is used to spread risk • “Total Return Approach” is version that emphasizes both capital gains and high income
Stock Investment Strategies (cont’d) • Aggressive Stock Management • Investors buy high-quality growth stocks, blue chip stocks, mid-cap stocks, tech stocks and cyclical stocks • Capital gains are primary goal • High level of risk due to emphasis on capital gains • Investors aggressively trade in and out of stocks, often holding for short periods • Timing the market is key element • Time consuming to manage
Stock Investment Strategies (cont’d) • Speculation and Short-Term Trading • Also called “day trading” • Investors buy speculative stocks, small-cap stocks and tech stocks • Capital gains are primary goal • Highest level of risk due to emphasis on capital gains in short time period • Investors aggressively trade in and out of stocks, often holding for extremely short periods • Looking for “big score” on unknown stock • Time consuming & high trading costs
What is Security Analysis? • “The process of gathering and organizing information and then using it to determine the intrinsic value of a share of common stock.”
What is Intrinsic Value? • Intrinsic Value • The underlying or inherent value of a stock, as determined through fundamental analysis • A prudent investor will only buy a stock if its market price does not exceed what the investor thinks the stock is worth. • Intrinsic value depends upon several factors: • Estimates of future cash flows • Discount rate • Amount of risk
“Top Down” Approach to Traditional Security Analysis • Step 1: Economic Analysis • State of overall economy • Step 2: Industry Analysis • Outlook for specific industry • Level of competition in industry • Step 3: Fundamental Analysis • Financial condition of specific company • Historical behavior of specific company’s stock
Efficient Market Hypothesis • Efficient Market: the concept that markets are efficient in processing new information - securities trade very close to their intrinsic values at all times. • Efficient market advocates believe: • Securities are rarely substantially mispriced in the marketplace • No security analysis is capable of finding mispriced securities more frequently than using random chance – the random walk theory.
Efficient Market Hypothesis • However, some analysts do generate: • above-market returns (> 500-600 bps) • for reasonably long periods of time (2-3 years). • This is called “Alpha”.
Who Needs Security Analysis in an Efficient Market? • Fundamental analysis is still important because: • All of the people doing fundamental analysis is the reason the market is efficient • Financial markets may not be perfectly efficient • Pricing errors are inevitable
Trading Securities • Fundamental analysis is still important because: • All of the people doing fundamental analysis is the reason the market is efficient • Financial markets may not be perfectly efficient • Pricing errors are inevitable
Chapter 3 (Bodie, Kane, & Marcus)How Securities are Traded • Primary v. Secondary Issues • Orders: Market v. Price Contingent; Short, Margin • Individual orders 100 shares v. Institutional block trades • Exchanges: NYSE, TSE, NASDAQ, foreign exchanges • Insider Trading – trading on material, non-public information.
Technical Analysis • Search for time-series patterns in stock prices • Extensive use of Charts • Expectation that there is systematic information in price trends. • Seems like theorizing with hindsight
1. Symmetrical Triangle • The symmetrical triangle pattern is formed when investors are unsure of a stock’s value. Once the pattern is broken, investors jump on the bandwagon, shooting the stock price north or south.
Symmetrical Triangle • Sideways movement; • Trading between two converging trend lines; • Breakout ¾ of the way to the apex.
2. Ascending or Descending Triangles • We observe a series of increasing troughs or peaks and the price is unable to break through a price barrier.
Ascending Triangle • Domino’s Pizza: example of fundamental analysis w/ technical timing.
3. Head and Shoulders • A prevailing pattern among short sellers - investors who profit from downtrends. • After three peaks, the stock plummets.
Head and Shoulders • The first trough is a signal that buying demand is starting to weaken. • Investors who believe the stock is undervalued start buying; • At the Head, selling starts on fears that the stock has run too high; • The ensuing decline is followed by another buying streak which fizzles out early.
Head and Shoulders • ck declines to its intrinsic value below the original price.
4. Triple and Double Bottoms or Tops: Reversals upon reversals • A “W” or ‘M” pattern forming indicates the current stock trend may be likely to shift.
Triple and Double Bottoms or Tops: Reversals upon reversals • A “W” or ‘M” pattern forming indicates the current stock trend may be likely to shift.